2011/04

米ダウ工業株日足・よく見られる下落パターンか?/Dow Jones Industrial Average (^DJI) Daily. This may be the bearish pattern that we often see.

2011/04/19

本日は米ダウ工業株日足についてです。

Today’s analyze is Dow Jones Industrial Average (^DJI) Daily.


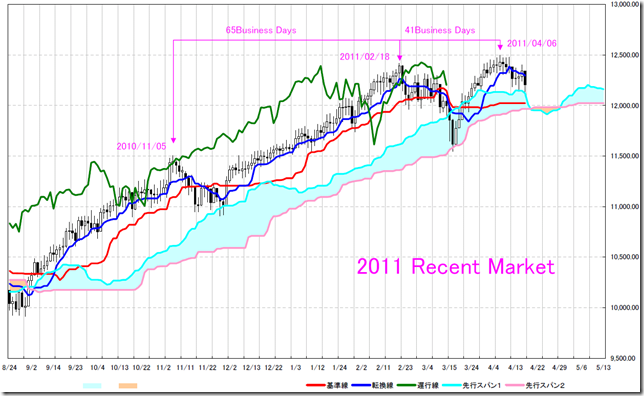
65営業日の上伸の後、41日後に再び高値をとっているようです。

After the price rice 65 business days, the price takes high again after the 41 days.

2011


これに似たパターンはダウ工業株ではしばしば見られる典型的な日柄パターンです。

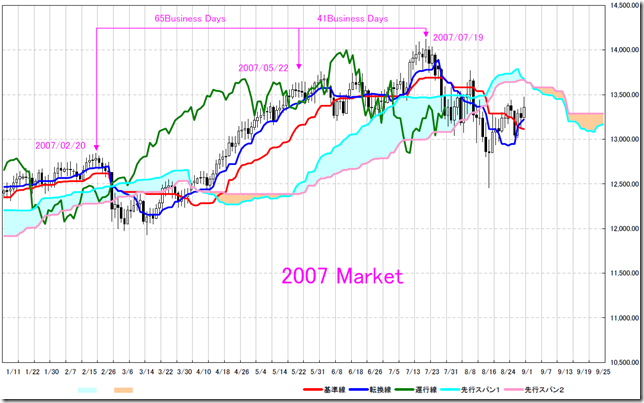
2007年の例を載せます。ここでは65営業日で明確な高値をとってはいませんが、65営業日+41営業日の日柄で、下落に転じています。

We can see some same pattern in DJI price fluctuation.

This is 2007 example. We can not see the obvious high price after 65 business days.

But we can see the down side trend after adding 65 business days and 41 business days.

2007


相場分析のリクエストがありましたら“Contact Us”からお知らせください。ご要望にお応えできるように努力いたします。

このブログはあくまでも個人的な見解であり、投資判断は各自でお願い致します。当ブログは一切の投資損益に対する責任を負いません。

ホームページに来て下さってありがとうございます。明日もよろしくお願いいたします。

If you have some request to analyze, please write to “Contact Us”.

We do best effort for your request.

These are only personal opinions on this blog, and you need the investment judgment in each one. This blog doesn’t assume the responsibility to all the investment profit and loss.

Thank for watching our contents. My best regards next day.


ドル円1時間足・82円台前半ターゲットか?/Dollar/Yen Hourly. The target price is upper 82yen level.

2011/04/18

ただいまの時間は日本時間13:00です。

本日はドル円の1時間足についてです。

I’m writing this report at 13:00 in Japan time.

Today’s analyze is Dollar/Yen hourly rate.


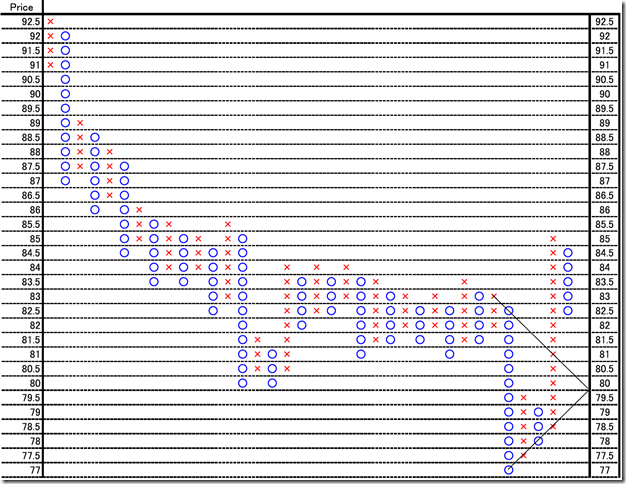
1枠0.05円、3枠転換の終値ポイントアンドフィギュアです。

日本時間12時台までのデータで作成しています。

45度サポートをどんどん割り込んできております。

最安値からのサポートである82円前半がまもなく迫っております。

ここを割り込むと下落へ弾みがつく可能性があります。

This is 0.05 price change and 3 box reversal close price’s Point and Figure chart.

We make it by 12 o’clock stand’s rate.

The price cuts many 45 degree support levels.

And now, the price is close to the lowest level of support (upper 82yen level).

If the price cuts this level, the price may go down side again.

005


1枠0.5円、3枠転換の終値ポイントアンドフィギュアです。

日本時間12時台までのデータで作成しています。

巨視的に相場をみています。

未だハラミのレンジ相場です。

This is 0.5 price change and 3 box reversal close price’s Point and Figure chart.

We make it by 12 o’clock stand’s rate.

We can see the big picture.

Now, the market is “The inside Day”.

05


相場分析のリクエストがありましたら“Contact Us”からお知らせください。ご要望にお応えできるように努力いたします。

このブログはあくまでも個人的な見解であり、投資判断は各自でお願い致します。当ブログは一切の投資損益に対する責任を負いません。

ホームページに来て下さってありがとうございます。明日もよろしくお願いいたします。

If you have some request to analyze, please write to “Contact Us”.

We do best effort for your request.

These are only personal opinions on this blog, and you need the investment judgment in each one. This blog doesn’t assume the responsibility to all the investment profit and loss.

Thank for watching our contents. My best regards next day.

© 2025 Retar