2011/11

日本10年債利回り日足・下方ブレークの模様/Japanese Government Bonds 10-Year Daily. Now, the market become down side trend.

2011/11/17

本日は、日本10年債利回り日足を分析しました。

Today, we analyze Japanese Government Bonds 10-Year Daily.


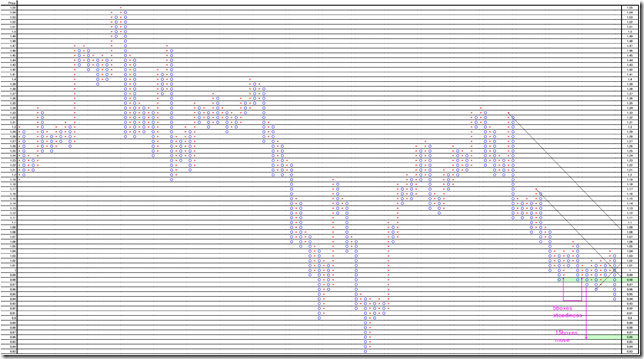
1枠0.01ポイント、3枠転換の終値ポイントアンドフィギュアです。

2009/01/05から昨日までのデータで作成しています。

下方ブレークを一旦キャンセルしています。

標準的なブレークスタイルにはなっていませんが、再び下方向にブレークした模様です。

今後の上昇時には0.98ポイント前後が、レジスタンスポイントとして機能すると思います。

ここを越えると「リスクオン」だと考えられます。

This is 0.01 price change and 3 box reversal close price’s Point and Figure chart.

We calculate it from 01/05/2009 to last day data.

The market once broke down side, but canceled.

This breaking pattern is not the “Standard breaking pattern”, but I think the market price may break down side.

In next rally market, we think 0.98 point may work as resistance point.

And if the market price goes over, the market atmosphere may become “RISK ON”.

PF


相場分析のリクエストがありましたら“Contact Us”からお知らせください。ご要望にお応えできるように努力いたします。

このブログはあくまでも個人的な見解であり、投資判断は各自でお願い致します。当ブログは一切の投資損益に対する責任を負いません。

ホームページに来て下さってありがとうございます。明日もよろしくお願いいたします。

If you have some request to analyze, please write to “Contact Us”.

We do best effort for your request.

These are only personal opinions on this blog, and you need the investment judgment in each one. This blog doesn’t assume the responsibility to all the investment profit and loss.

Thank for watching our contents. My best regards next day.


金を何グラム用意したら、日経225が買えるのか?/How much gold do we need to buy NIKKEI 225?

2011/11/16

本日は日経平均を分析しました。

Today, we analyze NIKKEI 225.


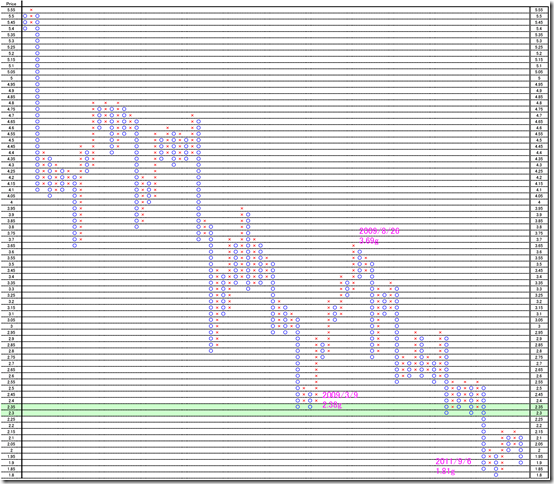
昨日に続き、金で日経225を買う場合、何グラム必要か?ということを考えてみたいとおもいます。

日経225の価格を東京金の値で割りました。

1枠0.05グラム、3枠転換の終値ポイントアンドフィギュアです。

注目するべきことは、日経225の価格はリーマン最安値以下に沈み込んでいることだと思います。

昨日のダウ同様に、このチャートではリーマン後、最安値をレジスタンスにしているとも考えられます。(緑色)

ダウと比較すると上げも、下げもダウよりキツイということもわかります。

Today, we consider how much gold do we need to buy NIKKEI 225?

The NIKKEI 225 price was divided by the value of the Tokyo Gold.

This is 0.05 price change and 3 box reversal close price’s Point and Figure chart.

What we need to notice is the NIKKEI 225 market price drop to the lowest after Lehman shock.

It is the same as that of yesterday’s Dow, in this chart; we can consider the lowest after Lehman shock may work as resistance.

Comparing DJI, NIKKEI 225 volatility is bigger.

Date

2009/3/9 (BASE)

2009/8/26 (HIGHEST)

2011/9/6 (LOWEST)

%

100%

155%

76%

PF


相場分析のリクエストがありましたら“Contact Us”からお知らせください。ご要望にお応えできるように努力いたします。

このブログはあくまでも個人的な見解であり、投資判断は各自でお願い致します。当ブログは一切の投資損益に対する責任を負いません。

ホームページに来て下さってありがとうございます。明日もよろしくお願いいたします。

If you have some request to analyze, please write to “Contact Us”.

We do best effort for your request.

These are only personal opinions on this blog, and you need the investment judgment in each one. This blog doesn’t assume the responsibility to all the investment profit and loss.

Thank for watching our contents. My best regards next day.

© 2025 Retar