2011/12

米ダウ工業株週足・先週は羽黒4号線。来年は荒れるはずです。/Dow Jones Industrial Average (^DJI) Weekly. The last week candle chart was “HAGURO No.4” candlestick. In the next year, the market may become volatile.

2011/12/29

本日は米ダウ工業株週足についてです。

Today’s analyze is Dow Jones Industrial Average (^DJI) weekly data.


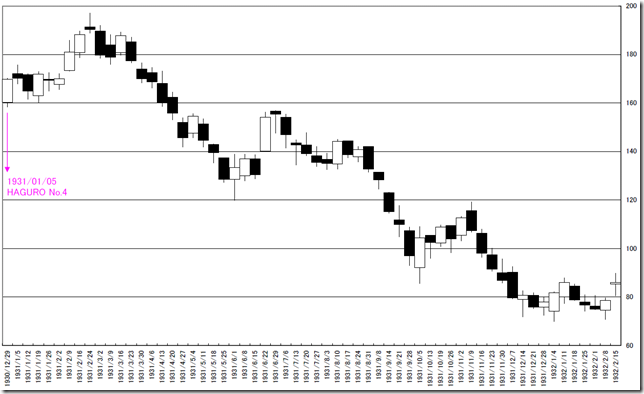
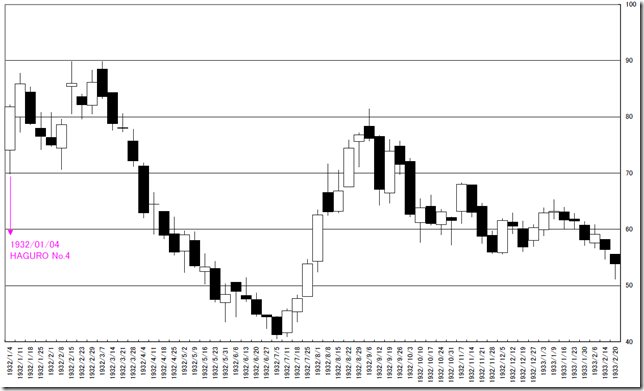
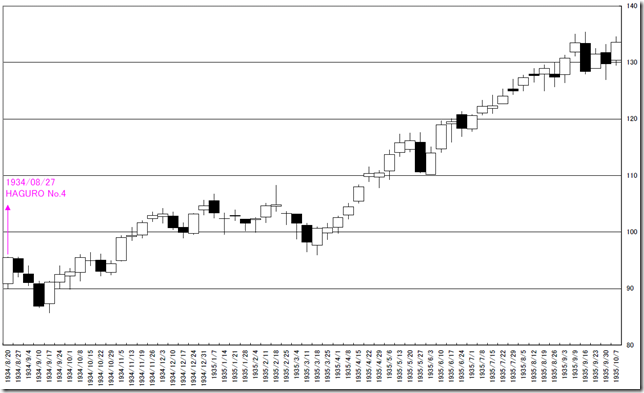
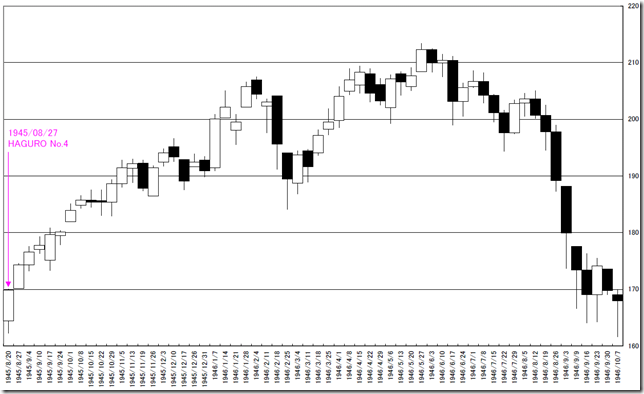
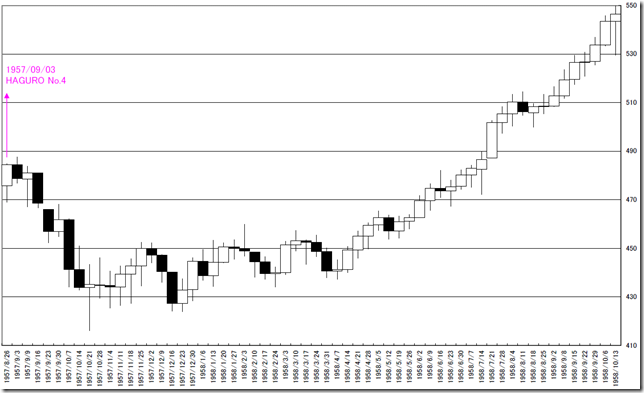
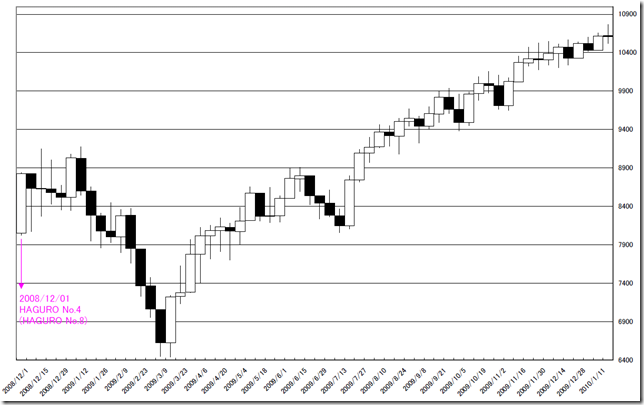
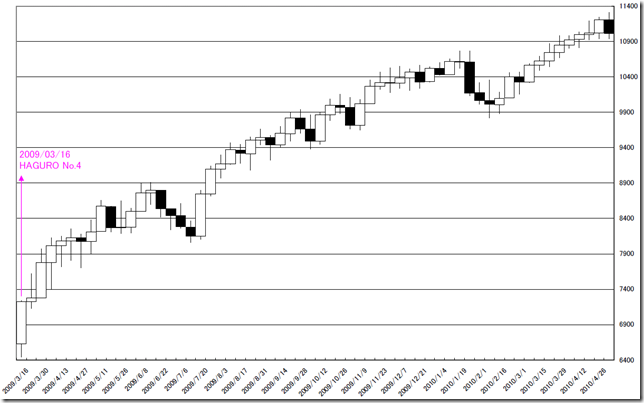
先週末は羽黒4号線を出しました。

羽黒4号線は、大変に珍しい線です。

フィルタリングしてみたところ1929年からの週足では、8週しか該当週はありませんでした。

(※2008年の場合は下ヒゲが短く分類上では羽黒8号線になるかもしれません。)

羽黒4号線を出した後は、相場の大荒れが想定されます。

特に年始に発生した1930年と1932年のパターンは今後を占う上で気になります。

Last week, DJI appeared “HAGURO No.4” candlestick.

“HAGURO No.4” candlestick is very unique candlestick.

We used our filtering program from year 1929; there are only relevant 8weeks.

(You may say year 2008 pattern may categorize as “HAGURO No.8” candlestick, but we categorized as “HAGURO No.4”.)

After “HAGURO No.4” candlestick appeared, the market became volatile.

Especially in this year, “HAGURO No.4” appeared opening of the year such as 1930 and 1932 is very close case.

TBL

1930

1932

1934

1945

1957

2008

2009


相場分析のリクエストがありましたら“Contact Us”からお知らせください。ご要望にお応えできるように努力いたします。

このブログはあくまでも個人的な見解であり、投資判断は各自でお願い致します。当ブログは一切の投資損益に対する責任を負いません。

ホームページに来て下さってありがとうございます。明日もよろしくお願いいたします。

If you have some request to analyze, please write to “Contact Us”.

We do best effort for your request.

These are only personal opinions on this blog, and you need the investment judgment in each one. This blog doesn’t assume the responsibility to all the investment profit and loss.

Thank for watching our contents. My best regards next day.


来年のドル円は大荒れか?/The next year’s USDJPY may become big volatile market.

2011/12/28

本日はドル円週足についてです。

昨日の金のレポートでは「為替が76.00-78.50円で動かない」という想定を考えてみました。

もしかすると、大きく動くかもしれません。

2011/12/11の週と2011/12/18の週のドル円は2週連続で上下動の大変小さい週でした。

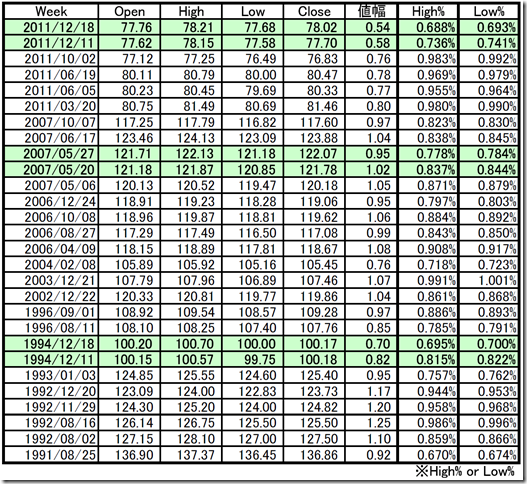
1991年以降の相場で、値幅が1%を切る相場には以下のようなものがあります。

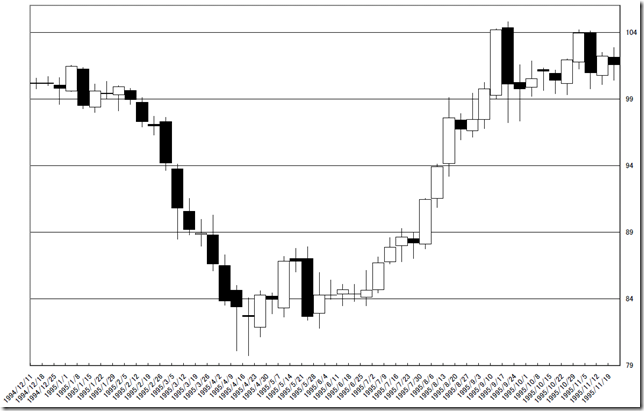
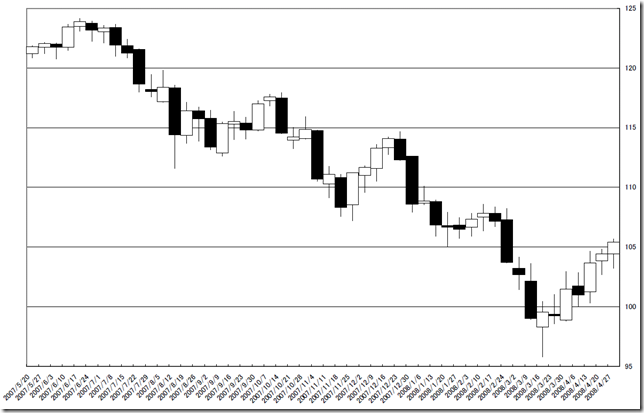
特に2週間連続値幅が1%以内に収まるものは太字にしており、1994年と2007年の2回しか事象は発生していませんでした。

Today’s analyze is Dollar/Yen weekly rate.

Last day, we reported that supposing “USDJPY is stable from 76.00 yen to 78.50yen”.

But the market may become a big volatile market.

The week of 2011/12/11 and 2011/12/18 was very small volatile in two-week continuation.

After 1991 market, the range of the market price below 1% is these.

Especially the continuation range of prices is settled to less than 1% for two weeks is made into the bold letter.

And these conditions occurs only two times (1994 and 2007).

tbl


その後50週のチャートをみると約20円下落しています。

珍しいことなので、同じことが起こるかどうかわかりません。

現在の相場は78円。ここからの20円下落すると58円。

2011/10/30の「中長期シナリオ」2010/10/17の「底値は?」などでは、50円台後半のターゲットを検証しており、計算値とも一致します。

一方、20円上の98円。一応、考えておきたいと思います。

When we see the 50 weeks chart after that, the market price goes down side about 20 yen.

And this is very curious occasion and we do not know the same opportunities may come.

The latest market price is 78yen around.

And if the market price may go 20yen down side, that price is 58yen.

Looking back to our “Mid to long term story” (10/30/2011) or “How much is the bottom?” (10/17/2010).

The second half of the level of 50 yen target makes sense.

On the other hand, the market price may go upper side, that price is 98yen.

We would like to think once.

1994

2007


相場分析のリクエストがありましたら“Contact Us”からお知らせください。ご要望にお応えできるように努力いたします。

このブログはあくまでも個人的な見解であり、投資判断は各自でお願い致します。当ブログは一切の投資損益に対する責任を負いません。

ホームページに来て下さってありがとうございます。明日もよろしくお願いいたします。

If you have some request to analyze, please write to “Contact Us”.

We do best effort for your request.

These are only personal opinions on this blog, and you need the investment judgment in each one. This blog doesn’t assume the responsibility to all the investment profit and loss.

Thank for watching our contents. My best regards next day.


© 2024 Retar