2012/01

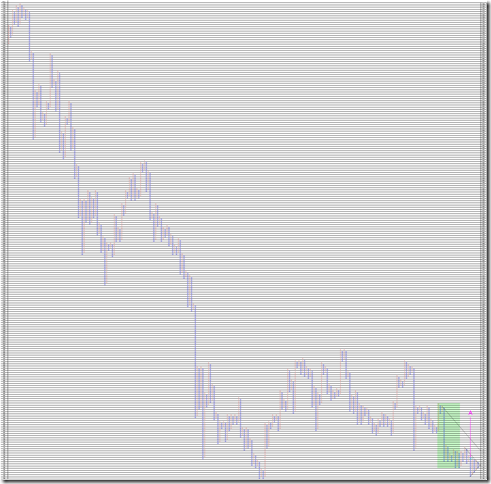
TOPIX日足。上方ブレーク740、下方ブレーク720/TOPIX (Tokyo stock Price Index) Daily. Upper side breaking is 740point. Down side breaking point is 720point.

2012/01/07

本日はTOPIX日足についてです。

Today’s analyze is TOPIX (Tokyo stock Price Index) daily.


1枠5point、3枠転換の終値ポイントアンドフィギュアです。

Aポイントで下方ブレークしたように見えましたが、値段を戻しているため、下方ブレークに失敗した形になっています。

現在はサポートとレジスタンスの45度線に挟み込まれたペナント形です。

前回のレポートは2011/11/20なので1月以上ハラミの中にあります。

今後はブレーク方向にトレンドが出やすいと考えられます。

上方ブレークポイントは740ポイント。

下方ブレークポイントは720ポイント。

This is 5point change and 3 box reversal close price’s Point and Figure chart.

The market may break to down side, but the price recovered and failed the down side breaking.

The market price forms a pennant formation and sandwiched resistance and support.

We reported TOPIX market at 11/20/2011  and the market is now “Inside day” since then.

We think the market is waiting for a trend.

The upper side breaking is 740point.

The down side breaking is 720point.

PF


相場分析のリクエストがありましたら“Contact Us”からお知らせください。ご要望にお応えできるように努力いたします。

このブログはあくまでも個人的な見解であり、投資判断は各自でお願い致します。当ブログは一切の投資損益に対する責任を負いません。

ホームページに来て下さってありがとうございます。明日もよろしくお願いいたします。

If you have some request to analyze, please write to “Contact Us”.

We do best effort for your request.

These are only personal opinions on this blog, and you need the investment judgment in each one. This blog doesn’t assume the responsibility to all the investment profit and loss.

Thank for watching our contents. My best regards next day.


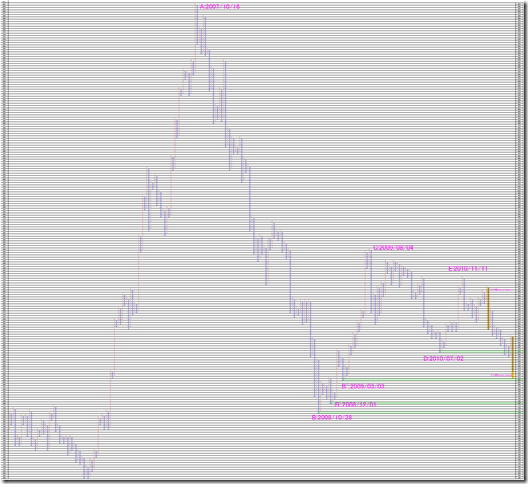
上海総合指数日足・値幅観測・ターゲット2100-2000ポイント / SSE Composite Index (Shanghai: 000001.SS) Daily. The target price may be 2100-2000 point.

2012/01/06

本日は上海総合指数日足です。

昨日のデータで分析しています。

Today’s analyze is SSE Composite Index daily data.

We use last day data.


1枠25ポイント、3枠転換の終値ポイントアンドフィギュアです。

マーケットは大きく”B”と”C”のハラミです。

この先の抵抗帯になりそうな場所を示しておきます。

This is 25 point change and 3 box reversal close price’s Point and Figure chart.

Taking a broad viewing of the market now is “Inside day” from “B” to “C”.

We suggest the some resistance points.

PF

1. 2050point

“X“の垂直方向は18枠。このまま18枠の下落なら2075ポイント。

2050ポイントとダブルボトムをつけてもおかしくありません。

“X” is 18 boxes move, so the same fall may occur; the target is 2075point.

This is close to 2050 point and may become double dip.


2. 1800point

2008/12/01安値へのチャレンジ。

The market price may challenge 12/01/2008 price.


3. 1700point

リーマンショック時の安値へのチャレンジ。

The market price may challenge the lowest price of the Lehman shock.


一目の計算もあわせてしてみます。

And also, we calculate “ICHIMOKU” way.

A

2007/10/16

HIGH

6124.04

B

2008/10/28

LOW

1664.93

B’

2008/12/01

LOW

1838.10

B’’

2009/03/03

LOW

2037.02

C

2009/08/04

HIGH

3478.01

D

2010/07/02

LOW

2319.74

E

2010/11/11

HIGH

3186.72


ABC波動/ABC wave

E calculation

-2794.18

N calculation

-981.1

V calculation

-148.15

CDE波動/CDE wave

E calculation

1161.47

N calculation

2028.45

V calculation

1452.76


長期波動ABCでは、0以下になっていることに注目です。

これを無視していいものかどうか??

短期的CDEでは、N計算値で2028.45ポイントが出てきます。

P&Fの2つのターゲット「B’’」ともほぼ一致します。

The long term wave “ABC” target is under zero.

What does it mean?

The short term wave “CDE” target is 2028.45 point (N calculation).

This is close to “B’’” point calculated by P&F two way.


相場分析のリクエストがありましたら“Contact Us”からお知らせください。ご要望にお応えできるように努力いたします。

このブログはあくまでも個人的な見解であり、投資判断は各自でお願い致します。当ブログは一切の投資損益に対する責任を負いません。

ホームページに来て下さってありがとうございます。明日もよろしくお願いいたします。

If you have some request to analyze, please write to “Contact Us”.

We do best effort for your request.

These are only personal opinions on this blog, and you need the investment judgment in each one. This blog doesn’t assume the responsibility to all the investment profit and loss.

Thank for watching our contents. My best regards next day.

© 2025 Retar