2012/02

NY金週足・急落がなければ、今週末は羽黒5号線か羽黒8号線でしょう/NY GOLD weekly. If a slump does not occur, the market price will form “HAGURO” No.5 or No.8 formation.

2012/02/24

本日はNY金を分析します。

昨日の分析のN計算値に近づき上値が重くなっているようです。

Today we analyze NY gold.

The market price is now close to N calculation value.


今週末のNY金は急落がなければ、羽黒5号線か羽黒8号線を出すことになります。

羽黒5号線について教科書では「類は友を呼ぶ線」だと記述されています。

羽黒8号線について教科書では「売り線」だと記述されています。

If a slump does not occur, the market price will form “HAGURO” No.5 or No.8 formation.

The textbook says “HAGURO” No.5 formation is “Next week will be the same formation”.

The textbook says “HAGURO” No.8 formation is “Sell”.

01

02

03

04

05


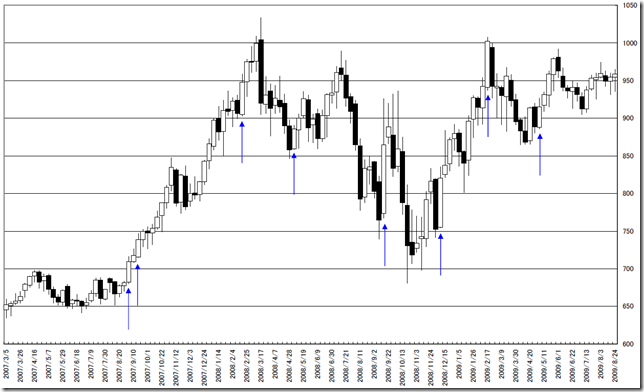
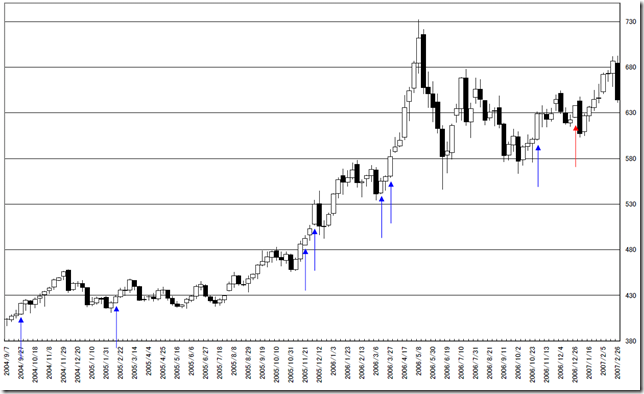
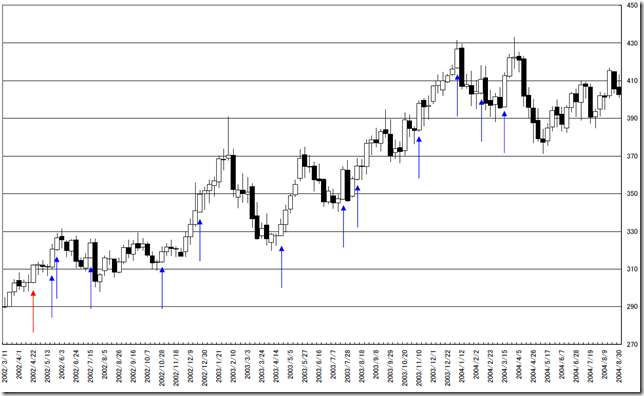
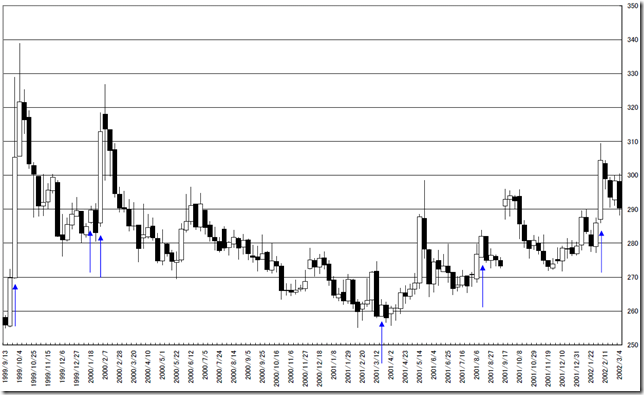
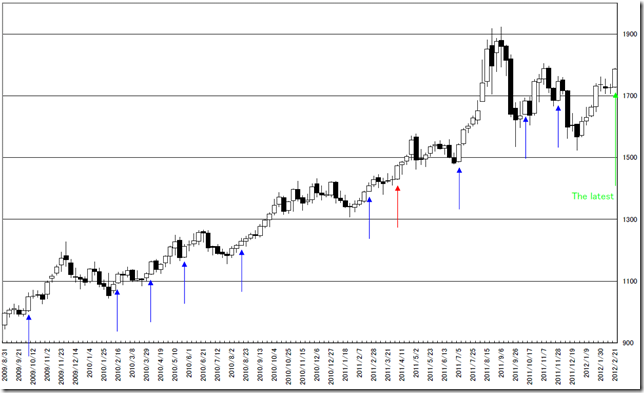
チャートは2000年以降の羽黒8号線と羽黒5号線を示しています。

赤い矢印は羽黒8号線、青色の矢印は羽黒5号線です。

最近の羽黒5号線は上伸する相場で出やすいと考えております。

羽黒8号線は出現が少なく判断するには資料が足りないと思います。

These chart points out “HAGURO” No.8 and No.5 formations.

These red arrows are “HAGURO” No.8 pointing out and these blue arrows are “HAGURO” No.5 pointing out.

In recent market, “HAGURO” No.5 formation often appears in bull market.

And it is difficult to judge “HAGURO” No.8 formation, because occasions are too rare.


相場分析のリクエストがありましたら“Contact Us”からお知らせください。ご要望にお応えできるように努力いたします。

このブログはあくまでも個人的な見解であり、投資判断は各自でお願い致します。当ブログは一切の投資損益に対する責任を負いません。

ホームページに来て下さってありがとうございます。明日もよろしくお願いいたします。

If you have some request to analyze, please write to “Contact Us”.

We do best effort for your request.

These are only personal opinions on this blog, and you need the investment judgment in each one. This blog doesn’t assume the responsibility to all the investment profit and loss.

Thank for watching our contents. My best regards next day.


NY金日足・値幅計算では1700ポイント後半か2000ポイント後半までの上伸想定/NY GOLD. Target price calculation says the target price may become 1700point high or 2000point high.

2012/02/23

本日はNY金を分析します。

Today we analyze NY gold.

CHART 


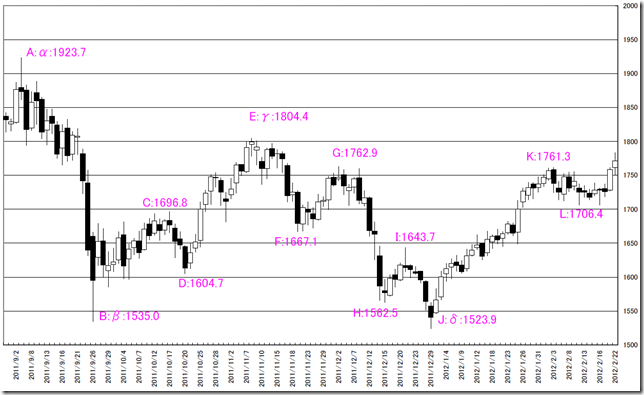
本日は一目均衡表の波動計算です。

現在の長期的な波動は「βγδ」になります。

E計算値とV計算値がきわめて近く2070-2090ポイントです。

経験的にはターゲットが重なるときはその値が適切なターゲットとして機能することが多いと思います。

ただし、N計算値が1790ポイントなので、ここで打ち返されることも想定する必要があります。

Today’s analyze is “ICHIMOKU” wave calculation.

The recent long term wave is “Beta – Gamma –Delta”.

E calculation target and V calculation target are very close; this is 2070 -2090 point.

In our experience, when the target price is very close, the real market price reaches very close.

But we need to notice the N calculation target price; this is 1790point around.

This point may work as resistance point.


Wave

E calculation

N calculation

V calculation

Reached

ABC(Down)

1146.3

1308.1

1373.2

1604.7(RVNE)

BCD(Up)

1858.6

1766.5

1788.9

1804.4

CDE(Down)

1512.6

1712.3

1405

1667.1

DEF(Up)

2004.1

1866.8

1941.7

1762.9

EFG(Down)

1529.8

1625.6

1571.3

1562.5

FGH(Up)

1858.7

1658.3

1963.3

1643.7

GHI(Down)

1362.1

1443.3

1481.3

1523.9

HIJ(Up)

1724.9

1605.1

1763.5

1761.3

IJK(Down)

1404.1

1641.5

1286.5

1706.4

JKL(Up)

1998.7

1943.8

1816.2

?

αβγ(Down)

1146.3

1415.7

1265.6

1523.9

βγδ(Up)

2073.8

1793.3

2084.9

?


相場分析のリクエストがありましたら“Contact Us”からお知らせください。ご要望にお応えできるように努力いたします。

このブログはあくまでも個人的な見解であり、投資判断は各自でお願い致します。当ブログは一切の投資損益に対する責任を負いません。

ホームページに来て下さってありがとうございます。明日もよろしくお願いいたします。

If you have some request to analyze, please write to “Contact Us”.

We do best effort for your request.

These are only personal opinions on this blog, and you need the investment judgment in each one. This blog doesn’t assume the responsibility to all the investment profit and loss.

Thank for watching our contents. My best regards next day.

© 2024 Retar