2012/04

バルチック海運指数日足・下位低迷を想定/Baltic Dry Index Daily. We assume the low side stays for some time.

2012/04/19

本日はバルチック海運指数日足を分析しました。

Today’s analyze is Baltic Dry Index Daily.


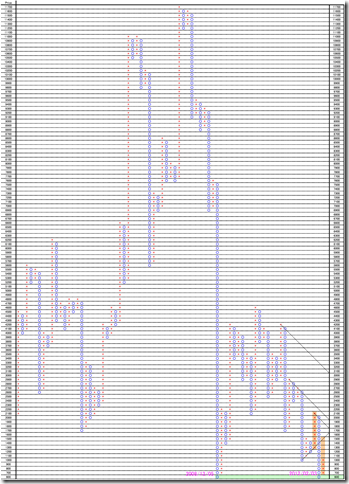
1枠100pt、3枠転換の終値ポイントアンドフィギュアです。

2003年5月から本日までのデータで作成しています。

昨日1000ポイントを超えたため話題になっております。

私たちは、このまま上値をどんどん上げていく相場ではないと考えております。

直近の上昇は9枠、現在の相場が9枠上昇したとしても、レジスタンスに当たります。

値固めしてからの上昇を想定しております。

This is 100pt change and 3 box reversal close price’s Point and Figure chart.

We plot it from 05/2003 to today’s data.

Last day, the market price went up to 1000 point over and got into the news.

We think this is not a real bullish market.

The latest rise was 9 boxes move and if the recent move becomes 9 boxes up, the market price reach the resistance point.

We assume the low side steadiness for some time.

PF


相場分析のリクエストがありましたら“Contact Us”からお知らせください。ご要望にお応えできるように努力いたします。

このブログはあくまでも個人的な見解であり、投資判断は各自でお願い致します。当ブログは一切の投資損益に対する責任を負いません。

ホームページに来て下さってありがとうございます。明日もよろしくお願いいたします。

If you have some request to analyze, please write to “Contact Us”.

We do best effort for your request.

These are only personal opinions on this blog, and you need the investment judgment in each one. This blog doesn’t assume the responsibility to all the investment profit and loss.

Thank for watching our contents. My best regards next day.


上海総合指数日足・しばらくはブル相場/ SSE Composite Index (Shanghai: 000001.SS) Daily. The market may become bull market for some time.

2012/04/18

本日は上海総合指数日足です。

2012/01/06のレポートでは、値幅観測2100-2000ポイントのターゲットを想定しましたが良い所で反転したと思います。

他の理由として、最高値(6124.04ポイント)からの「半値八掛け二割引」は2020ポイントになります。

Today’s analyze is SSE Composite Index daily data.

We reported “The target price may be 2100-2000 point.” in 01/06/2012 and the market reversed the expected target.

Other reason, 2020 point is the price from the highest (6124.04point) of “HANNE HACHIGAKE NIWARIBIKI” (Japanese traditional technical. The market bottom often becomes 33% from the highest.).


1枠25ポイント、3枠転換の終値ポイントアンドフィギュアです。

本日は、45度線のレジスタンスやサポートにからむ動きを考えたいと思います。

This is 25 point change and 3 box reversal close price’s Point and Figure chart.

We consider the 45 degree resistance and support line and how did it worked.

PF


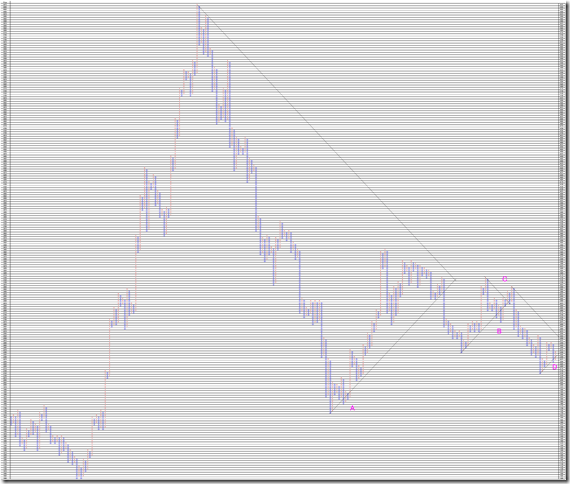
A地点/A point

最安値からの45度線サポートを再度割り込み上昇に転じているところがポイントです。

ポイントアンドフィギュアでは先に割り込んだ方向に値段が向きやすい傾向があります。

This is the point the market price cut the 45 degree support line and went up again.

In point and figure chart, we need to notice the cutting first direction and this often suggests the market condition.


B地点とC地点/B point and C point

先にB地点に向かってからC地点に向け上昇しました。

ここでは強気になってはいけないところです。

The market price cut the support (B point) and went up (C point).

This is the point you do not become bullish.


D地点/D point

先に45度線のサポートを割り込んでいます。

今後値段がレジスタンスを超え上昇したとしても、下げやすいと考えられます。

The market price cut 45 degree support first.

We think the market price may cut 45 resistance levels but this is not the real bullish market; the market price will often go back again.


相場分析のリクエストがありましたら“Contact Us”からお知らせください。ご要望にお応えできるように努力いたします。

このブログはあくまでも個人的な見解であり、投資判断は各自でお願い致します。当ブログは一切の投資損益に対する責任を負いません。

ホームページに来て下さってありがとうございます。明日もよろしくお願いいたします。

If you have some request to analyze, please write to “Contact Us”.

We do best effort for your request.

These are only personal opinions on this blog, and you need the investment judgment in each one. This blog doesn’t assume the responsibility to all the investment profit and loss.

Thank for watching our contents. My best regards next day.

© 2025 Retar