2012/09

ニューヨーク銀週足。一目波動計算;37.4ポイントを超える動きだと強気相場/NY silver Weekly; Going over 37.4point, this will suggest the real bullish market calculated by “ICHIMOKU” way. /纽约白银。超过37.4。这将表明真正的牛市“一目”的方式计算。

2012/09/25

ニューヨーク銀週足。一目波動計算;37.4ポイントを超える動きだと強気相場

NY silver Weekly; Going over 37.4point, this will suggest the real bullish market calculated by “ICHIMOKU” way.

纽约白银。超过37.4。这将表明真正的牛市“一目”的方式计算。


本日はNY銀週足です。

Today, we analyze NY Silver weekly.


週足で一目の波動計算をおこないました。

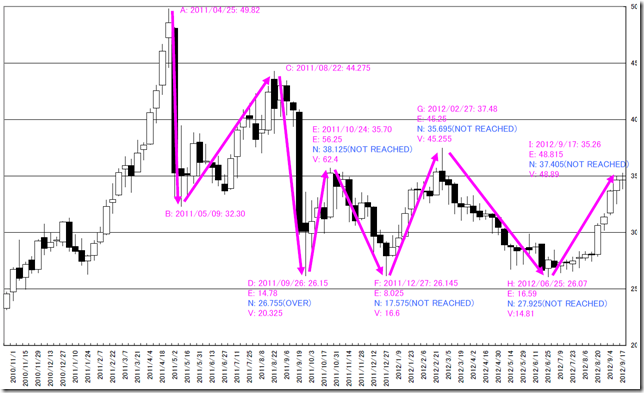
計算してみると、ABC波動のみがほぼN計算値を達成していますが、その他の波動はN計算値に到達せず反転を繰り返しています。

典型的な持ち合いです。

現在の波動はFGHI波動となり、この波動のN計算値の到達点は37.405ポイント。

この値を大陽線などでわかりやすく超える動きが出てきたのであれば、レンジブレークの可能性があります。

むしろ、このまま下げの波動を形成してくれば持ち合い、もしくは、”ABC”波動の継続となります。

We use “ICHIMOKU” wave calculation in weekly data.

“ABC” wave only reached the N calculation value and other waves can not reach and reversal; this suggests steadiness.

The recent wave is “FGHI” and the N calculation target value is 37.405 point.

And if a big white body candle will appear, this will become obvious bullish market.

If the market prices will be reversal, we can confirm the steadiness or “ABC” wave is still going on.

CHART


相場分析のリクエストがありましたら“Contact Us”からお知らせください。ご要望にお応えできるように努力いたします。

このブログはあくまでも個人的な見解であり、投資判断は各自でお願い致します。当ブログは一切の投資損益に対する責任を負いません。

ホームページに来て下さってありがとうございます。明日もよろしくお願いいたします。

If you have some request to analyze, please write to “Contact Us”.

We do best effort for your request.

These are only personal opinions on this blog, and you need the investment judgment in each one. This blog doesn’t assume the responsibility to all the investment profit and loss.

Thank for watching our contents. My best regards next day.


ニューヨーク銀にトレンド変化の兆し/There are some possibilities NY silver market trend may change./有一些可能性纽约白银市场的趋势可能会改变。

2012/09/24

ニューヨーク銀にトレンド変化の兆し

There are some possibilities NY silver market trend may change.

有一些可能性纽约白银市场的趋势可能会改变。


本日はNY銀日足です。

Today, we analyze NY Silver.


2012/07/25のレポート「ニューヨーク銀にトレンドの兆し。ヒゲ抜けに注目」では、以下のような指摘をしておりました。

「最近のだましは1営業日で帰ってくる(C点、D点、E点)パターンが多いようにみえます。

2-3営業日の間戻さないようなら、本物のトレンドの可能性があります。」

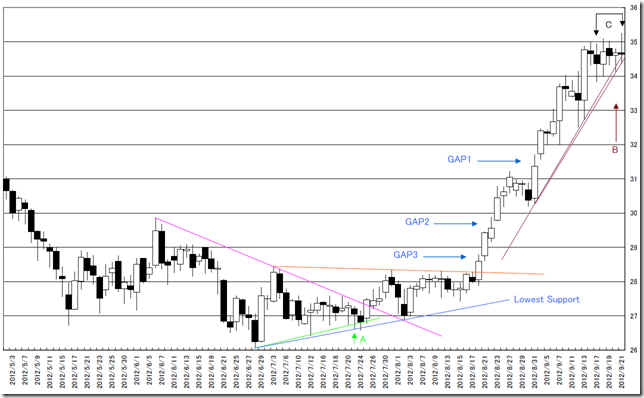
このレポートを書いたのはA点です。

この2営業日後に戻してきており、ここが最低の支持線となりました。

最近はどの相場でも「チョロン」としたダマシの抜けなどをして反転することが多く、こういう時はトレンド変化に注視して本物を待つしかありません。

We reported “There are some possibilities NY silver market may become a trend. See lower shadow cutting” in 07/25/2012.

“We can see “One day reversal pattern” in recent market. (C point D point, E point)

If the market price can not recover 2 or 3 days, this may be the true trend occurrence.”

And we wrote this report at “A” point.

And the market price recovered 2 days after, and the lowest point became the support line.

In recent market, the price move often becomes a fake and we need to wait and watch the real trend.

DAY


さて、今度はBのサポートを割り込みました。

上伸余力は鈍っていると思います。

変化の兆しになるかもしれません。

また、陰陽の連続(C)も気になる変化の兆しです。

もし、落ちてくることがあれば、まずは、私たちはGAP1に注目したいと思います。

And now, the market price cut the support “B”.

Upper side power is weaken.

And the continuity of black-and-white (“C” point) may suggest the trend reversal.

If the market price may fall, we need to watch “GAP A”.


相場分析のリクエストがありましたら“Contact Us”からお知らせください。ご要望にお応えできるように努力いたします。

このブログはあくまでも個人的な見解であり、投資判断は各自でお願い致します。当ブログは一切の投資損益に対する責任を負いません。

ホームページに来て下さってありがとうございます。明日もよろしくお願いいたします。

If you have some request to analyze, please write to “Contact Us”.

We do best effort for your request.

These are only personal opinions on this blog, and you need the investment judgment in each one. This blog doesn’t assume the responsibility to all the investment profit and loss.

Thank for watching our contents. My best regards next day.

© 2024 Retar