2012/09

米10年債日足。要注意のレジスタンスが発生。2.00%超えに注意/ CBOE Interest Rate 10-Year T-No (Chicago Options: ^TNX) Daily; the best cautious resistance appeared and we need to taking care of 2.00% over. /美国10年债。要注意的抵抗运动发生。如果超越2.00%请注意。

2012/09/20

米10年債日足。要注意のレジスタンスが発生。2.00%超えに注意。おそらく、ビックリするようなドル円の動きとも関連があるとも思います。

CBOE Interest Rate 10-Year T-No (Chicago Options: ^TNX) Daily; the best cautious resistance appeared and we need to taking care of 2.00% over. This may relates to a big USDJPY jump.

美国10年债。要注意的抵抗运动发生。如果超越2.00%请注意。恐怕,都想与象很吃惊一样的美元日元的活动和有关联。


本日は米10年債日足の分析です。

10年債の1枠0.05pt、3枠転換の終値ポイントアンドフィギュアです。

この相場は今後の趨勢を極めて的確に示していると思います。

チャートから様々なドラマを感じました。

このチャートの特徴を列挙します。

Today, we analyze CBOE Interest Rate 10-Year T-No (Chicago Options: ^TNX).

This is 10-Year bond 0.05pt change and 3 box reversal close price’s Point and Figure chart.

This chart will imply the future market figure.

We feel some dramas in this chart.

And following are our consideration.

PF


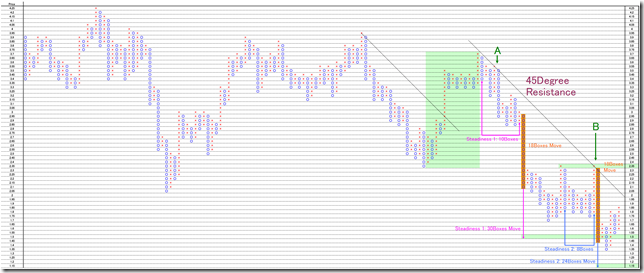
45度レジスタンスは強烈なレジスタンス/The 45 degree resistance is very strong

長期にわたるダブルトップ、長期にわたる45度線は常に強力な支持線のことが多いです。

今回は長期にわたる45度線を形成しているため(A点、B点)、越えることは大きな意味をもちます。

The long term double top and long 45 degree lines often work as strong resistances.

In this case, the market price formed 45 degree resistance line (A and B point); this means as strong resistance point.


持ち合い1からのメジャードブレーク達成/Majored move from “Steadiness 1” has already reached.

10枠持ち合い30枠ムーブを達成。

10 boxes steadiness and 30 boxes move.


持ち合い2からのメジャードブレーク未達成/Majored move from “Steadiness 2” does not have already reached.

8枠持ち合い24枠ムーブを未達成。

下方向へのエネルギーは残されています。

8 boxes steadiness and 24 boxes move.

There still have enough energy to down side.


垂直18枠ムーブ/Vertical 18 boxes move

これは下方向へレンジを切り下げたことを示唆しています。

また現在はメジャードブレークの基点と一致していることも重要だと考えられます。

These suggest the market range change to down side.

And now, the starting point is same point as majored breaking starting point.


2.35pointにダブルトップ/2.35 point double top

離れのダブルトップは強力なレジスタンスです。

The long term double top works as strong resistance point.


上記の考察から、上方向、下方向へのムーブを考えたいと思います。

どちらでも良いのですが、動き出したときは大きな動きとなりやすいと考えられます。

相場の未来を示唆するものだと感じます。

From our consideration, we need to taking care of big up or down side move.

In any cases, this will become a big move.

This may suggest the future market.


上方向シグナルは2.00%超え/Up side signal is 2.00% over

45度線のブレークはおおよそ2%です。

The 45 degree resistance cutting point is about 2.00%.


下方向シグナルは新安値/Down side signal is new low

1.15ポイントへの始動は1.35ポイント以下への新安値です。

The down side to 1.15point starting is cutting 1.35point; new low.


相場分析のリクエストがありましたら“Contact Us”からお知らせください。ご要望にお応えできるように努力いたします。

このブログはあくまでも個人的な見解であり、投資判断は各自でお願い致します。当ブログは一切の投資損益に対する責任を負いません。

ホームページに来て下さってありがとうございます。明日もよろしくお願いいたします。

If you have some request to analyze, please write to “Contact Us”.

We do best effort for your request.

These are only personal opinions on this blog, and you need the investment judgment in each one. This blog doesn’t assume the responsibility to all the investment profit and loss.

Thank for watching our contents. My best regards next day.


ドル円中長期Part 2。日足でみても驚きの上下があるかもしれません/Dollar/Yen mid and long term view Part 2; there may occur a big jump or fall. /美元/日元。说不定有惊恐的上和下。

2012/09/19

ドル円中長期Part 2。日足でみても驚きの上下があるかもしれません

Dollar/Yen mid and long term view Part 2; there may occur a big jump or fall.

美元/日元。说不定有惊恐的上和下。


「ドル円は動きません」という新聞記事をしばしば見かけますが、今はそうでも「いつまでもそうかなぁー」と私たちは思っております。

本日はドル円についてです。

We often see “USDJPY does not move” in some news or reports.

But is it really so? We think it will be happen some big deal in some day.

Today’s analyze is Dollar/Yen rate.


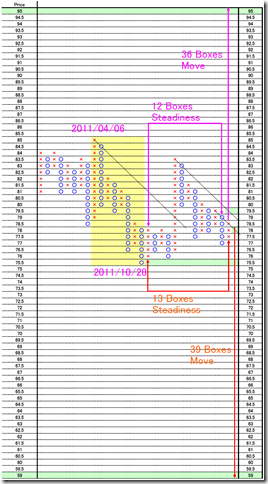
私たちは「ドル円長期。1970年からの月足PFを作ってみましたが、そのうちアッと驚く下落があるかもしれません」(2012/09/13)に出しましたが、日足のP&Fでもその兆候はあると思います。

1枠0.5円、3枠転換の終値P&Fです。

ニューヨーククローズの日足の値で書いております。

現在の価格は2011/04/06高値(85.48円)と2011/10/28安値(75.80円)の間に挟まれたハラミ状態です。

1年近く相場の持ち合いは続いています。

仮にこのまま、85.00円を上抜けるような円安がやってくると、12枠持ち合いからの上昇となるため36枠移動となり、ターゲットは95円付近になります。

一方、このまま下落していくのであれば13枠持ち合い39枠移動からの下落となり、ターゲットは59円となります。

今のところ45度線を越える動きとなっていないため、下方向への警戒が高まります。

反転して上値を抜かず、持ち合いが続けば、より上下へのエネルギーを溜めるばかりです。

いつまでも動かない相場はないため、いつか必ず大きなうごきがあることを心に留めておきたいと思います。

We reported “Dollar/Yen; we made the P&F chart from 1970 and there may occur a big fall in some day” in 09/13/2012 and there is a sign in P&F daily chart.

This is 0.5 point change and 3 box reversal close price’s Point and Figure chart.

We used NY close daily data.

The recent highest was 04/06/2012 (85.48yen) and the recent lowest was 10/28/2012 (75.80yen); now is inside if these prices.

The steadiness is about one year.

If big news occur and USDJPY may rise and will go over 85.00yen; the target price is 95yen over.

(12boxes steadiness and 36boxes move.)

If big news occur and USDJPY may fall and will cut 75.50yen; the target price is 59yen.

(13boxes steadiness and 39boxes move.)

And now, the market price does not cut 45 degree resistance line; a fall may come?

If the market price reverse and the steadiness will be going on; the moving power is accumulating.

We think there is no market without big move and we need to remind “A big move will occur” in some day.

PF


相場分析のリクエストがありましたら“Contact Us”からお知らせください。ご要望にお応えできるように努力いたします。

このブログはあくまでも個人的な見解であり、投資判断は各自でお願い致します。当ブログは一切の投資損益に対する責任を負いません。

ホームページに来て下さってありがとうございます。明日もよろしくお願いいたします。

If you have some request to analyze, please write to “Contact Us”.

We do best effort for your request.

These are only personal opinions on this blog, and you need the investment judgment in each one. This blog doesn’t assume the responsibility to all the investment profit and loss.

Thank for watching our contents. My best regards next day.

© 2024 Retar