2012/09

東京白金中長期・他の商品相場と異なると見ています/ Tokyo Platinum; there are many differences from other commodity markets. /东京白金。我们认为着其他的商品行情不同。

2012/09/18

東京白金中長期・他の商品相場と異なると見ています

Tokyo Platinum; there are many differences from other commodity markets.

东京白金。我们认为着其他的商品行情不同。


NYゴールドは1770-1780ポイントの抵抗帯にぶつかり、もじもじしています。

ピークアウトした可能性もあります。 (2012/09/112012/09/10のレポート参照)

NY gold market has already reached the 1770-80 point and struggling.

The market price might have already peaked out. (See our 09/11/2012 and 09/10/2012 report.)


さて、本日は東京白金長期の分析です。

Today, we analyze Tokyo Platinum long term view.


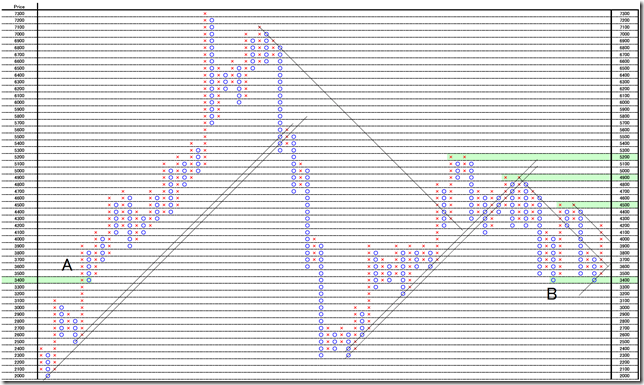
1枠100ポイント、3枠転換の終値ポイントアンドフィギュアです。

現在は2007年高値と2008年安値のハラミです。

たとえば金、銀のように2008年以降にほかの商品相場が新高値を付けているのとは違います。

セオリーではハラミを抜けたほうがトレンドで、中長期の視点では未だに持ち合いであるということです。

最近は3400ポイント(B地点)で最近、ダブルボトムをつけています。

A地点でもメジャードブレークの開始地点となっているため、3400ポイントは今後の下値の重要ポイントになると考えております。

上値の目処としては、4500ポイント、4900ポイント、5200ポイントなどにダブルトップがあるため今後の抵抗帯として想定したいと思います。

This is 100 point change and 3 box reversal close price’s Point and Figure chart.

Now, the market price is inside between 2007 high and 2008 low.

After 2008, other market prices went over 2007 high such as gold or silver but this market is not.

According to the market theory, the trend will appear the cutting direction and now is steadiness.

The recent made double dip at 3400 point (B point).

And it became majored breaking starting point (A point); we think 3400 point will become the important support point.

The upper side resistance points are 4500, 4900 and 5200point and they are double top points.

And these will become resistance points.

PF


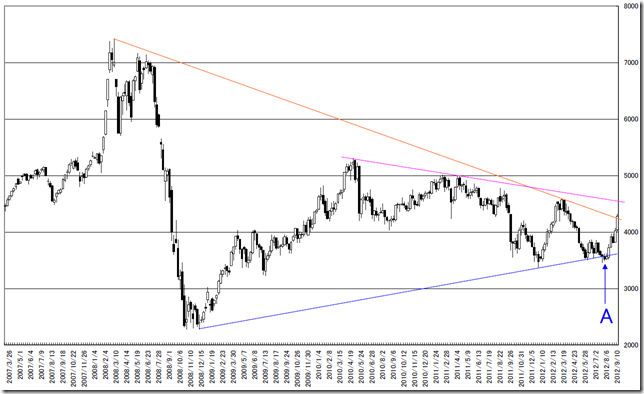
週足のチャートからも「A」付近でサポート割れを起こしているため、LONGにするのは見合わせです。

On the chart, the market price cut the lowest support (A point); we do not recommend taking new long position.

CHART


相場分析のリクエストがありましたら“Contact Us”からお知らせください。ご要望にお応えできるように努力いたします。

このブログはあくまでも個人的な見解であり、投資判断は各自でお願い致します。当ブログは一切の投資損益に対する責任を負いません。

ホームページに来て下さってありがとうございます。明日もよろしくお願いいたします。

If you have some request to analyze, please write to “Contact Us”.

We do best effort for your request.

These are only personal opinions on this blog, and you need the investment judgment in each one. This blog doesn’t assume the responsibility to all the investment profit and loss.

Thank for watching our contents. My best regards next day.


シカゴ・オプションVIX(恐怖心理指数)週足。S&P500のロングはまだお勧めできません。/Chicago Options: ^VIX Weekly; we do not recommend you taking new long position in S&P500. /芝加哥期权VIX。买S&P500不推荐。

2012/09/16

シカゴ・オプションVIX(恐怖心理指数)週足。S&P500のロングはまだお勧めできません。

Chicago Options: ^VIX Weekly; we do not recommend you taking new long position in S&P500.

芝加哥期权VIX。买S&P500不推荐。


「いずれにせよ、ロング・ポジションをとって臨むべきである」

ある日本の証券会社のレポートからです。

「どのような理由であれLONGを取りたくなるほど、マーケット環境はいいんだぁ」と思わせる理由付けができるのでしょう。

私たちは考えても無駄なので、値動きを観察し、手を動かしてチャートに定規をあて相場をみていくしかありません。

“In any reason, we should take new long position.”

This is the report from some stock brokerage firm.

He says “this must be a big chance taking long position and anyone can know this is the good circumstances”.

It is useless, even if it thinks; we only need analyze.


本日は2012/09/15付・日経新聞朝刊「投資に役立つ経済指標 VIX指数」を検証してみました。

この記事のVIXの判定基準は以下のようになります。

  • 20ポイント未満が「安全圏」
  • 20ポイント以上40ポイント未満が「警戒ゾーン」
  • 40ポイント以上が「危険ゾーン」とされる
  • 「VIX指数は15ポイントを下回ったら楽観が行き過ぎたとみて、高値圏にある株の持ち高を減らすべきだ」(国内証券)との声もある。

Today we analyze the Nikkei newspaper article “Useful investment index VIX” in 09/15/2012.

This article says the VIX usages are under these.

  • Less than 20 point is “Safe zone”.
  • From 20 point to 40 point is “Caution zone”.
  • Over 40 point is “Danger zone”.
  • “If the price goes under 15 point, this often says the stocks price are too high and close your long position”. (Domestic dealer)


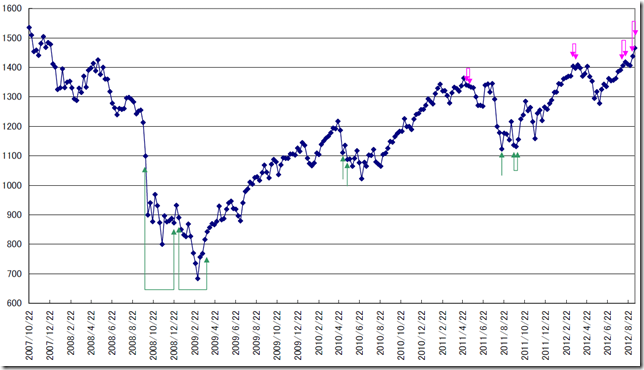
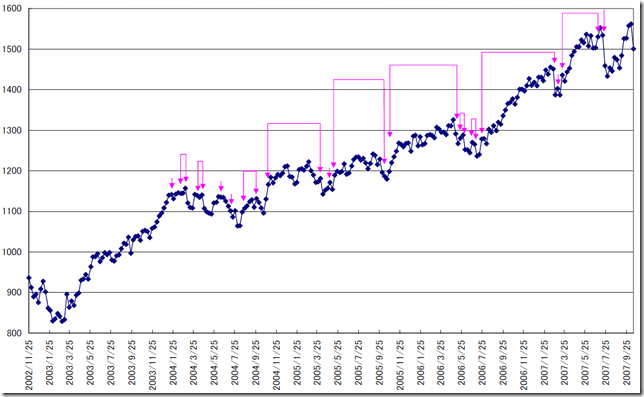
チャートはSP500の週末終値です。

ピンクは15ポイント未満の地点です。

緑は40ポイント以上の危険ゾーンです。

This is S&P500 week end close price.

The pink points are “Less than 15 point”.

The green points are 40 point over.

CHART1

CHART2


40ポイント以上の「危険ゾーン」で買うといい感じみたいです。

また、最近は2週連続15ポイント未満でクローズした後に押しが入ることが多いと思います。

過去の例では、本物の上昇なら数週間連続でVIXは15ポイント未満となるはずです。

もし、今週末に「15ポイント未満でクローズ」したのであれば3週目。

相場の変化の初動である可能性があります

一方、15ポイント以上であるならば相場は引き続き高値圏とみております。

If the market price will go over 40 point, these are good long taking points.

And when the price went through 15 point below in two weeks, the market price made a dip.

In past cases, if it became a real bull market, the price went under 15 point for several weeks.

If the market price will close under 15 point in this week, this will become the third week of closing under 15 point.

This may suggest the trend direction.

If the price will go over 15 point, this may say now making a dip.


相場分析のリクエストがありましたら“Contact Us”からお知らせください。ご要望にお応えできるように努力いたします。

このブログはあくまでも個人的な見解であり、投資判断は各自でお願い致します。当ブログは一切の投資損益に対する責任を負いません。

ホームページに来て下さってありがとうございます。明日もよろしくお願いいたします。

If you have some request to analyze, please write to “Contact Us”.

We do best effort for your request.

These are only personal opinions on this blog, and you need the investment judgment in each one. This blog doesn’t assume the responsibility to all the investment profit and loss.

Thank for watching our contents. My best regards next day.

© 2025 Retar