2013/02

東京円建て金・4630円を切るようならトレンド転換/Tokyo market gold calculated in yen (Daily Data). If the market price will cut 4630yen, the market trend may change. /东京黄金。如果市场价格将降低4630日元,可能会改变市场的趋势。

2013/02/21

東京円建て金・4630円を切るようならトレンド転換

Tokyo market gold calculated in yen (Daily Data). If the market price will cut 4630yen, the market trend may change.

东京黄金。如果市场价格将降低4630日元,可能会改变市场的趋势。


本日は東京円建て金を分析します。

Today, we analyze Tokyo gold market calculated in yen.


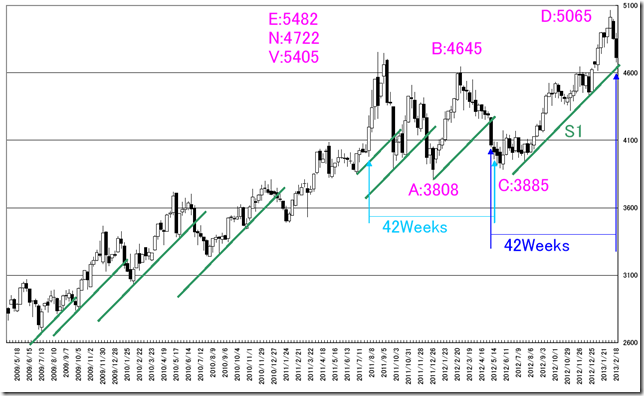
今週は42週目なので強力な変化週です。(2012/02/12レポート参照)

D地点は一目の計算値として中途半端なところなので上伸途上とみてはおります。

トレンド転換、押しの境目は4630ポイントを守りきれるかどうかとみております。

This week is the 42nd week and strong “HENKABI” week. (02/1/2013 report)

“D” point was the halfway of the target price; we think the bullish trend is going on.

The trend changing confirming point is 4630yen around.

CHART


相場分析のリクエストがありましたら“Contact Us”からお知らせください。ご要望にお応えできるように努力いたします。

このブログはあくまでも個人的な見解であり、投資判断は各自でお願い致します。当ブログは一切の投資損益に対する責任を負いません。

ホームページに来て下さってありがとうございます。明日もよろしくお願いいたします。

If you have some request to analyze, please write to “Contact Us”.

We do best effort for your request.

These are only personal opinions on this blog, and you need the investment judgment in each one. This blog doesn’t assume the responsibility to all the investment profit and loss.

Thank for watching our contents. My best regards next day.


日経平均月足・11800円付近に抵抗帯/NIKKEI 225 Monthly; there is strong resistance point at 11800yen around. /日经225指数。是强阻力点11800日元左右。

2013/02/20

日経平均月足・11800円付近に抵抗帯

NIKKEI 225 Monthly; there is strong resistance point at 11800yen around.

日经225指数。是强阻力点11800日元左右。


本日は日経平均月足についてです。

Today’s analyze is NIKKEI 225 monthly.


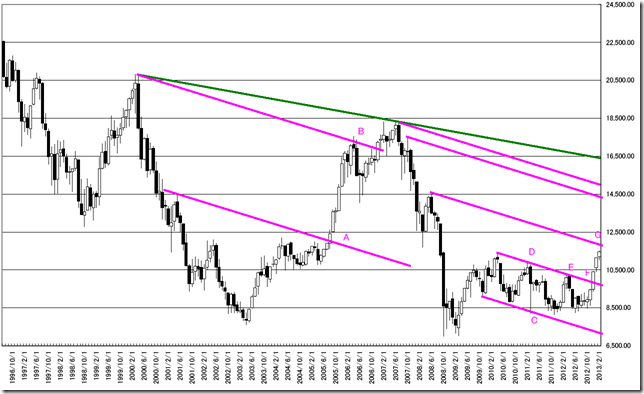
日経平均の注目のトレンドラインについて紹介します。

ピンクは同じ角度で引かれたトレンドラインです。

We introduce the notable trend line.

The pink trend lines are drawing in same degree.

CHART


A地点/A Point

超えたところが上昇開始地点となりました。

This was the point of rocket jump starting.


B地点/B Point

高値を形成してヒゲだけ残して下落しました。

The market price only remained upper side shadow and felled.


C地点/C Point

震災時のサポートです。

This was the point of 311 disasters.


D地点、E地点、F地点/D,E,F Point

最近のレジスタンスとブレーク地点です。

These points were the resistances and the breaking point.


G地点/G Point

今月は11800円付近に位置しています。

戻り高値から引いた線であるということは、A地点に類似する線です。

大陽線で抜けると、大きな上昇相場になると考えられます。

レジスタンスとしても機能しそうな地点だと考えられます。

The resistance point exists 11800yen around.

This line is similar to “A” point; drawing from recovery high.

If the market price will cut this price with big white candle stick, this will be a big jump deal.

And we also remind this point will be the strong resistance point.


相場分析のリクエストがありましたら“Contact Us”からお知らせください。ご要望にお応えできるように努力いたします。

このブログはあくまでも個人的な見解であり、投資判断は各自でお願い致します。当ブログは一切の投資損益に対する責任を負いません。

ホームページに来て下さってありがとうございます。明日もよろしくお願いいたします。

If you have some request to analyze, please write to “Contact Us”.

We do best effort for your request.

These are only personal opinions on this blog, and you need the investment judgment in each one. This blog doesn’t assume the responsibility to all the investment profit and loss.

Thank for watching our contents. My best regards next day.

© 2024 Retar