2013/05

東京円建て月足金・長期的には強気維持・サポートは3箇所/Tokyo market gold monthly calculated in yen; we are bullish from the long term view and there are 3 support points. /东京市场的黄金。看长的观点。在3个支持点。

2013/05/23

東京円建て月足金・長期的には強気維持・サポートは3箇所

Tokyo market gold monthly calculated in yen; we are bullish from the long term view and there are 3 support points.

东京市场的黄金。看长的观点。在3个支持点。


明日から5月28日まで留守にします。

更新はお休みします。よろしくお願いします。

We are absent from tomorrow to May 28.

We can not renew our blog.

本日は東京円建て金についてです。

トレンドラインからみたマーケットを紹介します。

Today we analyze Tokyo market gold weekly calculated in yen.

We introduce the trend lines on the chart.

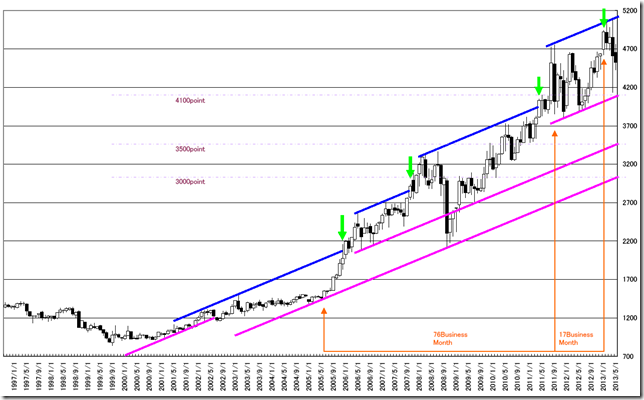
私たちのトレンドラインの引き方は以前にも紹介したように「同じ角度」で何箇所も引けることを一番重要視しています。

特に最外郭ラインと同じ角度で引けた場合は角度が高まります。

このマーケットでも最外郭ラインと同一角度のトレンドラインが沢山引くことができるので、合理性があると思います。

現在の相場に最外郭線を引くと4100、3500、3000と3箇所のサポートが現れます。

どれもが強力なサポートになる可能性があると見ています。

もっと重要なことは4月の安値が、4100のサポートまで到達せずに反転したことです。

巷では「強気材料はない」などという論調ですが、チャート上では、サポートにも到達せずに反転したということになります。

もうひとつの状況証拠ですが、緑の矢印のポイントに注目です。

レジスタンスポイントを超え、新高値を更新したあとに必ずプルバックしていることに注目です。

もう一度上に離れるとしても、下方向を、もう1度や2度試してくると見ています。

Our principle of drawing trend lines is “Drawing same degree trend lines on the chart”.

Especially, it is the most outer line; the trend line will work well.

In this market, we can draw same degree trend lines on the chart; these lines are rational.

We can find out 3 trend lines on the chart. (4100, 3500, 3000)

These will work as strong trend lines.

And the best important point is the low price in April can not reach the support line and reversed.

We can see “The bearish article” on some news source but the market price can not reach the trend line on the chart.

Other evidence is the green arrow points.

When the market price took new high cutting the trend line, the market price pulled back in every time.

If the market will be the new bullish trend, we think the market price will pull back once or twice.

CHART


相場分析のリクエストがありましたら“Contact Us”からお知らせください。ご要望にお応えできるように努力いたします。

このブログはあくまでも個人的な見解であり、投資判断は各自でお願い致します。当ブログは一切の投資損益に対する責任を負いません。

ホームページに来て下さってありがとうございます。明日もよろしくお願いいたします。

If you have some request to analyze, please write to “Contact Us”.

We do best effort for your request.

These are only personal opinions on this blog, and you need the investment judgment in each one. This blog doesn’t assume the responsibility to all the investment profit and loss.

Thank for watching our contents. My best regards next day.


東京円建て金・先週が戻り高値ならターゲットは3800ポイント前後/Tokyo market gold calculated in yen; if the last week high was the recovery high, the target point will be 3800 point. /东京市场的黄金。如果上周高位追高,在目标点是3800点。

2013/05/22

東京円建て金・先週が戻り高値ならターゲットは3800ポイント前後

Tokyo market gold calculated in yen; if the last week high was the recovery high, the target point will be 3800 point.

东京市场的黄金。如果上周高位追高,在目标点是3800点。


本日は東京円建て金についてです。

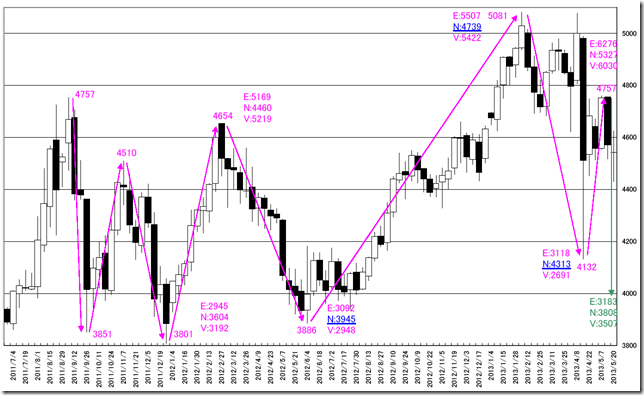
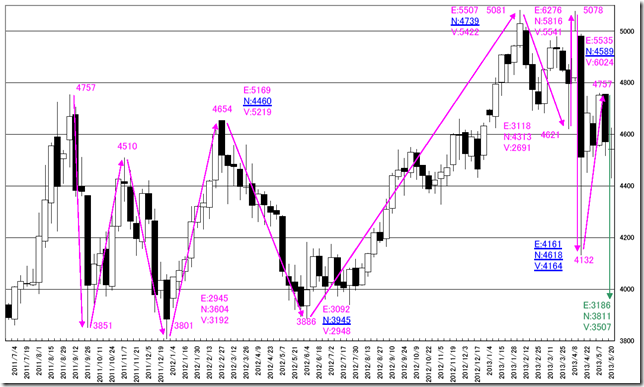
一目の波動計算を紹介します。

直近の大相場をどう見るかということで、2種類のチャートを用意しています。

波動をピンクで書いてみました。

青い字はオーバーシュートしている地点です。

Today we analyze Tokyo market gold weekly calculated in yen.

We introduce “ICHIMOKU” wave method.

We prepared two types of chart.

And we draw wave as pink arrow.

The blue points are overshoot points.

ここ1年ほど、高値側にも安値側にもN計算値をオーバーシュートしています。

N計算値をオーバーシュートした時点で売り買いをすれば良いトレードになったわけです。

もし、先週の高値が金の戻り高値だとすると以下の説明で下落相場の波動であると説明できます。

1、4月の安値がすべての計算値を超えて下落している。2、戻り高値が計算値に到達できていない。

これは典型的な下落波動になります。

現在のターゲットは、どちらのチャートでもN計算値はほとんど変わりません。

3800ポイント前後を目指してくると見るのが自然でしょう。

For the past about one year, the market price was overshoot for ”N” calculation’s higher and lower side.

And if you may buy at that time, it was a nice selling and buying chance.

If the last week high was the recovery high, we can confirm “Now is bearish”.

The reasons are under these.

1. The market lowest price in April went down all types of calculation.

2. The recovery high can not reach the target price.

This is the typical falling wave.

The latest target price is very close in these two charts.

And we think the market price will reach 3800 point around and this is rational.

CHART1

CHART2


相場分析のリクエストがありましたら“Contact Us”からお知らせください。ご要望にお応えできるように努力いたします。

このブログはあくまでも個人的な見解であり、投資判断は各自でお願い致します。当ブログは一切の投資損益に対する責任を負いません。

ホームページに来て下さってありがとうございます。明日もよろしくお願いいたします。

If you have some request to analyze, please write to “Contact Us”.

We do best effort for your request.

These are only personal opinions on this blog, and you need the investment judgment in each one. This blog doesn’t assume the responsibility to all the investment profit and loss.

Thank for watching our contents. My best regards next day.

© 2024 Retar