2013/05

東京円建て金週足・羽黒12(13)号線・反転ポイントになりやすい/Tokyo market gold calculated in yen; “HAGURO” No. 12(13) formation; this occasion may be the reversal point. /东京市场的黄金。用”羽黑法”验证了。“羽黑”3号。这一次可能是反转点。

2013/05/13


東京円建て金週足・羽黒12(13)号線・反転ポイントになりやすい

Tokyo market gold calculated in yen; “HAGURO” No. 12(13) formation; this occasion may be the reversal point.

东京市场的黄金。用”羽黑法”验证了。“羽黑”3号。这一次可能是反转点。


本日は東京円建て金週足についてです。

結論は、暫くはレンジを切り替え持ち合い。

Today we analyze Tokyo market gold weekly calculated in yen.

Our conclusion is the market will become the steadiness changing the market price range for some time.

週足線では羽黒12(13)号線となりました。

200週で11回出現しています。

金を長期保有するのであれば、この足が出た翌週に購入すると良い足だったと思います。

短期的には底入れを確認、反転などが起こってきた線だったと思います。

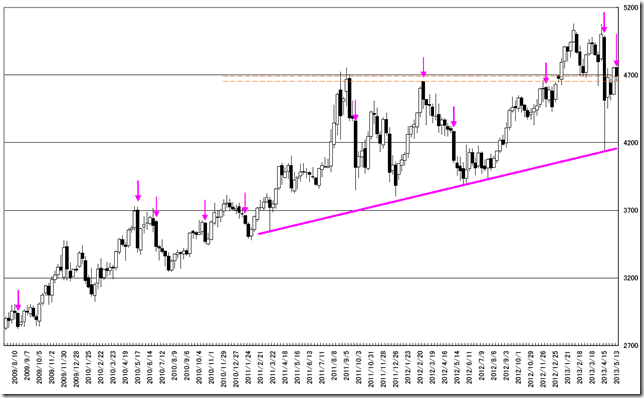
問題はピンクのサポートです。

この線は以前のサポートよりも角度が緩くなっています。

今後、この線を巡る攻防があると見ていますので、注意して見ていきたいと思います。

また、もうひとつはオレンジ色の窓。

ここは値段の真空地帯であり、最近の下落がオーバーシュートしていると見ています。

先週は正気を取り戻し下限でヒゲを出して、サポートとして利いています。

一方、上方向はダブルトップです。

ここを抜けると上値めどが出てくると見ています。

In this week, the market price formed “HAGURO” No. 12(13) formation.

In past 200 weeks, it appeared 11 times.

If you are long term investor, these were the nice points for buying gold in next week.

In short term, these points became the reversal points.

The best important occasion was pink support line.

The angle is loose rather than support previous in this line.

This line will be the bullish and the bearish divided line and we need to watch it.

And other important factor is orange colored gap.

This point will work as the support point and the latest fall was overshooting.

In last week, the market price recovered its senses and this support point worked well.

On the other hand, the upper side resistance is double top.

And if the market price will cut it, we will calculate the next target price.

CHART


相場分析のリクエストがありましたら“Contact Us”からお知らせください。ご要望にお応えできるように努力いたします。

このブログはあくまでも個人的な見解であり、投資判断は各自でお願い致します。当ブログは一切の投資損益に対する責任を負いません。

ホームページに来て下さってありがとうございます。明日もよろしくお願いいたします。

If you have some request to analyze, please write to “Contact Us”.

We do best effort for your request.

These are only personal opinions on this blog, and you need the investment judgment in each one. This blog doesn’t assume the responsibility to all the investment profit and loss.

Thank for watching our contents. My best regards next day.


Japanese Stock 野村ホールディングス (8604)月足・変化月は2013年5月、2014年2月、3月、5月、9月・変化日アルゴリズム検出/Japanese Stock “Nomura HLD” (8604) Monthly; 05/2013, 02/2014, 03/2014, 05/2014 and 09/2014 month will be “HENKABI”; Automated “HEKABI” extract algorism. /野村企業諮詢(8604)。用算法查出变化日。 “变化日”月是2013年5月、2014年2月、3月、5月与9月。

2013/05/12

Japanese Stock 野村ホールディングス (8604)月足・変化月は2013年5月、2014年2月、3月、5月、9月・変化日アルゴリズム検出

Japanese Stock “Nomura HLD” (8604) Monthly; 05/2013, 02/2014, 03/2014, 05/2014 and 09/2014 month will be “HENKABI”; Automated “HEKABI” extract algorism.

野村企業諮詢(8604)。用算法查出变化日。 “变化日”月是2013年5月、2014年2月、3月、5月与9月。


本日は野村ホールディングス(8604)月足についてです。

私たちは変化日を求めるためのアルゴリズムを研究しています。

最新アルゴリズムの信頼性が高まってきたため、本日は紹介したいと思います。

今回は未知のデータである野村ホールディングス(8604)株を扱いました。

日本株は銘柄が多く、チャート観察も疲れます。

新アルゴリズムでは変化日を自動で求めることができるので、変化日の月にだけ注目すれば、とてもやりやすくなります。

Today’s analyze is about Japanese Stock “Nomura HLD” (8604) (Monthly Data).

This brand jumped recent.

We develop the new type of algorism seeking for “HENKABI” (Based on “ICHIMOKU” method).

Since the reliability of the newest algorithm has increased, we would like to introduce today.

And we started the development of the parallel computing system applying this algorithm.

We deal the Japanese Stock “Nomura HLD” (8604).

Japanese stock brands are very much various and watching is a heavy job.

This new type of algorism can get the “HENKABI” automatically; we only need to watch “HENKABI” month around and this is very reasonable method.

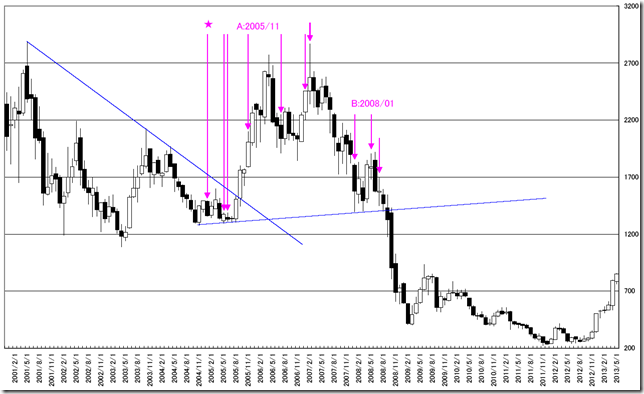
時計を2005/01/01に戻します。

2005/01/01時点の値動きを使用して、最新のアルゴリズムで求められた変化日が図の矢印の月です。

We back to the past (01/01/2005) and analyze.

Allowed points are “HENKABI” point using our latest algorism.

CHART1


それぞれ、意味がある地点だと思いますが、特にA:2005/11とB:2008/11を捕らえていることが、いい感じです。

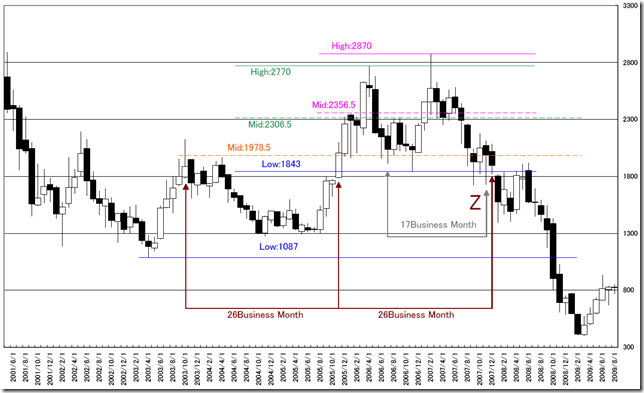
Z地点は崩れへの最良のポイントとして、17週と26週前(51,52週)に安値を割り込み、崩れを捕らえています。

もちろんこの地点の下げとまりと戻り高値を捉え切っていることも素晴らしいと思います。

手計算と自動計算を組み合わせることで、強力なツールとなります。

Each of them is very meaningful points.

Especially, “A: 11/2005” and “B: 11/2008” are the best “HENKABI” captured points.

We think Z point is the starting of the falling point and this system captures 17 weeks and 26 weeks (51 and 52 weeks) falling point.

And this system captures falling and pulling backed points.

Combining hand calculation and automatic calculation works our best method.

CHART2


先週末までのデータを使用して、アルゴリズムで求めた変化日は2013年05月、2014年2月、3月、5月、9月です。

Using last week data and we can conclude 05/2013, 02/2014, 03/2014, 05/2014 and 09/2014 months will be the “HENKABI” month.


相場分析のリクエストがありましたら“Contact Us”からお知らせください。ご要望にお応えできるように努力いたします。

このブログはあくまでも個人的な見解であり、投資判断は各自でお願い致します。当ブログは一切の投資損益に対する責任を負いません。

ホームページに来て下さってありがとうございます。明日もよろしくお願いいたします。

If you have some request to analyze, please write to “Contact Us”.

We do best effort for your request.

These are only personal opinions on this blog, and you need the investment judgment in each one. This blog doesn’t assume the responsibility to all the investment profit and loss.

Thank for watching our contents. My best regards next day.

© 2025 Retar