2013/06

東京円建て銀週足・羽黒12(13)号線・今週以降にどこかで66.2ポイント以下になる可能性が高い/Tokyo market silver calculated in yen; “HAGURO” No. 12(13) formation; the market price will be lower than 66.2 point in this week or subsequent weeks. /东京市场的白銀。“羽黑” 12(13)号。市场价格将低于66.2点,下周或随后的几个星期。

2013/06/18

東京円建て銀週足・羽黒12(13)号線・今週以降にどこかで66.2ポイント以下になる可能性が高い

Tokyo market silver calculated in yen; “HAGURO” No. 12(13) formation; the market price will be lower than 66.2 point in this week or subsequent weeks.

东京市场的白銀。“羽黑” 12(13)号。市场价格将低于66.2点,下周或随后的几个星期。


本日は東京円建て銀週足についてです。

結論は今週以降にどこかで66.2ポイント以下になる可能性が高いとみています。

Today we analyze Tokyo market silver weekly calculated in yen.

Our conclusion is the market price will be lower than 66.2 point in this week or subsequent weeks.

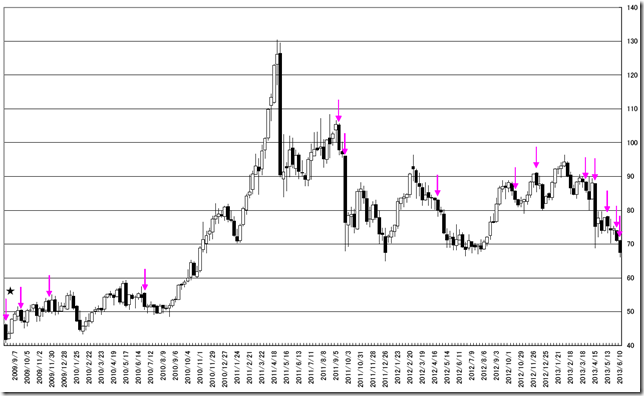
週足線では羽黒12(13)号線となりました。

200週で14回出現しています。

星のポイントは更なる下値を取っていないところです。

翌週以降にどこかで66.2ポイント以下になる可能性が高いとみています。

しばらくこの相場は底練りか弱気と見るべきです。

In this week, the market price formed “HAGURO” No. 12(13) formation.

In past 200 weeks, it appeared 14 times.

The star point is not taken lower price.

The market price will be lower than 66.2 point in next week or subsequent weeks.

This market will be bearish or sticking in lower price.

CHART


相場分析のリクエストがありましたら“Contact Us”からお知らせください。ご要望にお応えできるように努力いたします。

このブログはあくまでも個人的な見解であり、投資判断は各自でお願い致します。当ブログは一切の投資損益に対する責任を負いません。

ホームページに来て下さってありがとうございます。明日もよろしくお願いいたします。

If you have some request to analyze, please write to “Contact Us”.

We do best effort for your request.

These are only personal opinions on this blog, and you need the investment judgment in each one. This blog doesn’t assume the responsibility to all the investment profit and loss.

Thank for watching our contents. My best regards next day.


日経平均日足・トレンドライン的にやりづらい/NIKKEI 225 Daily; now is difficult. /日经225指数。现在这是困难的。

2013/06/17

日経平均日足・トレンドライン的にやりづらい

NIKKEI 225 Daily; now is difficult.

日经225指数。现在这是困难的。


本日は日経平均についてです。

本日変化日ですが、何がおこるかわかりづらい日です。(2013/06/01レポート参照)

Today’s analyze is NIKKEI 225.

Today is “HENKABI” and we can not estimate “HENKABI” reason. (See 06/01/2013 report)

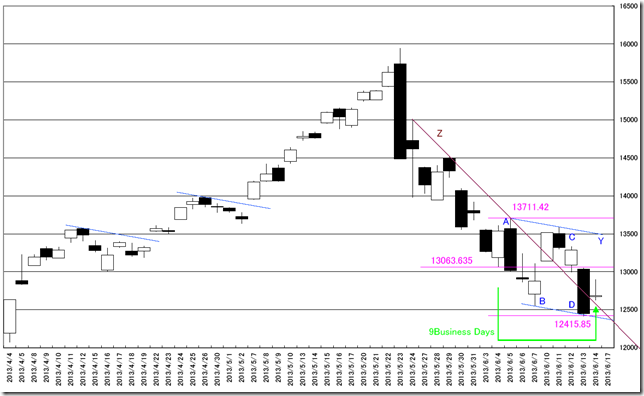
トレンドラインを引いてみました。

Zを超えてきたので底打ちかなとは思います。

打診買いレベルであるとみています。

問題は弱気のABCD波動です。

しかし、反転パターンとして、Dが最安値となり反転というのもよくあります。

Yトレンドラインが超えられると「反転ね」をわかりやすいのです。

2013/06/03のレポートでは、反転ポイントを予測していましたが、それ以降に安値を割り込んでいるので弱気です。

結論は、やりづらい相場です。

We add the trend lines on the chart.

The market price cut Z line and this may be the signal of test buying.

The worst problem is ABCD wave.

But there are many cases D point was the lowest and the market trend reversed.

If the market price will cut Y trend line, this is obvious reversal signal.

In 06/03/2013 report, we analyze the reversal point, but the market price went lower; still bearish.

Our conclusion is now is very difficult market.

CHART


相場分析のリクエストがありましたら“Contact Us”からお知らせください。ご要望にお応えできるように努力いたします。

このブログはあくまでも個人的な見解であり、投資判断は各自でお願い致します。当ブログは一切の投資損益に対する責任を負いません。

ホームページに来て下さってありがとうございます。明日もよろしくお願いいたします。

If you have some request to analyze, please write to “Contact Us”.

We do best effort for your request.

These are only personal opinions on this blog, and you need the investment judgment in each one. This blog doesn’t assume the responsibility to all the investment profit and loss.

Thank for watching our contents. My best regards next day.

© 2025 Retar