2013/06

日経平均週足・羽黒16号線・翌週の実体抜きにエッジ/NIKKEI 225 Weekly; “HAGURO” No.16 formation; cutting with candle stick body, it will be an edge. /日经225指数。“羽黑”16号。如果超过了蜡烛体,这将是一个机会。

2013/06/15

日経平均週足・羽黒16号線・翌週の実体抜きにエッジ

NIKKEI 225 Weekly; “HAGURO” No.16 formation; cutting with candle stick body, it will be an edge.

日经225指数。“羽黑”16号。如果超过了蜡烛体,这将是一个机会。


本日は日経平均週足についてです。

Today’s analyze is NIKKEI 225 weekly.

新しい日経平均の羽黒分析方法を思いつきました。

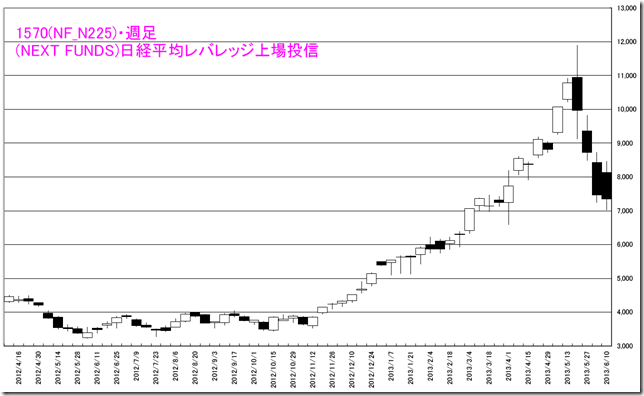
日経平均には、日経平均レバレッジ・インデックスETF(1570)があります。

1570とザラ場を比較すると面白いことがわかります。

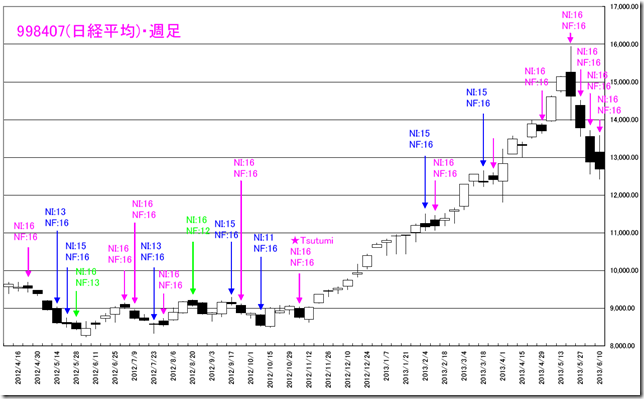
ザラ場週足線では羽黒16号線となりました。

63週で15回出現しています。

ETFとザラ場共に羽黒16号線を出した時(ピンク)、実体抜きはトレンドになるようです。

We find out new type of Nikkei 225 “HAGURO” analysis method.

There is Nikkei 225 Leveraged Index (1570).

Comparing ETF and continuous session, we can find out unique feature.

In this week continuous session, the market price formed “HAGURO” No. 16 formation.

In past 63 weeks, it appeared 15 times.

When ETF and continuous session are “HAGURO” No. 16 formation (See pink), cutting body will be the trend.

CHART1

CHART2


相場分析のリクエストがありましたら“Contact Us”からお知らせください。ご要望にお応えできるように努力いたします。

このブログはあくまでも個人的な見解であり、投資判断は各自でお願い致します。当ブログは一切の投資損益に対する責任を負いません。

ホームページに来て下さってありがとうございます。明日もよろしくお願いいたします。

If you have some request to analyze, please write to “Contact Us”.

We do best effort for your request.

These are only personal opinions on this blog, and you need the investment judgment in each one. This blog doesn’t assume the responsibility to all the investment profit and loss.

Thank for watching our contents. My best regards next day.


日本10年債利回り日足・上昇警戒、ブレークポイントは0.89ポイント/Japanese Government Bonds 10-Year Daily; there is a jump risk and the breaking point is 0.89 point. /日本10年国债收益率。有一个跳转风险与突破点是0.89点。

2013/06/14

日本10年債利回り日足・上昇警戒、ブレークポイントは0.89ポイント

Japanese Government Bonds 10-Year Daily; there is a jump risk and the breaking point is 0.89 point.

日本10年国债收益率。有一个跳转风险与突破点是0.89点。


本日は、日本10年債利回り日足の分析です。

結論は底打ちくさい雰囲気が漂い始めたことです。

Today, we analyze Japanese Government Bonds 10-Year Daily.

This market may be taken the bottom.

1枠0.01ポイント、3枠転換の終値ポイントアンドフィギュアです。

2009/01/05から昨日までのデータで作成しています。

2013/06/05のレポートの通り、金利上昇に備える局面だと見ています。

短期的な上方ブレークポイントは、0.89ポイント、下方ブレークポイントは0.79ポイント。

リアル「悪い金利上昇」となり、参加者を震え上がらせる事態になるかもしれません。

しっかり気を引き締めたいと思います。

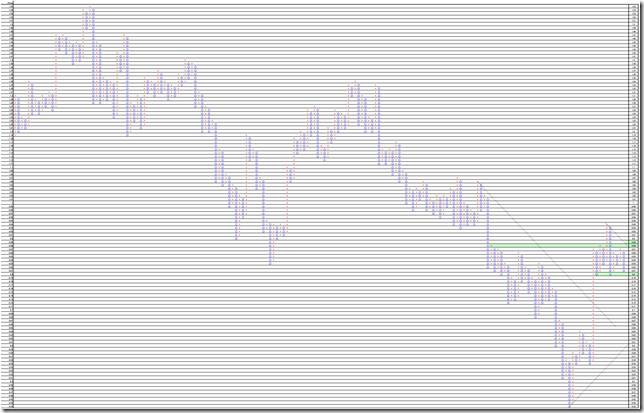
This is 0.01 price change and 3 box reversal close price’s Point and Figure chart.

We calculate it from 01/05/2009 to last day data.

We need to prepare for interest jump. (See 06/05/2013 report)

The short term upper side breaking point is 0.89 point and down side breaking point is 0.79 point.

Next jump may become the real “A bad interest rise” and we may need real fear.

We need to watch the market.

PF


相場分析のリクエストがありましたら“Contact Us”からお知らせください。ご要望にお応えできるように努力いたします。

このブログはあくまでも個人的な見解であり、投資判断は各自でお願い致します。当ブログは一切の投資損益に対する責任を負いません。

ホームページに来て下さってありがとうございます。明日もよろしくお願いいたします。

If you have some request to analyze, please write to “Contact Us”.

We do best effort for your request.

These are only personal opinions on this blog, and you need the investment judgment in each one. This blog doesn’t assume the responsibility to all the investment profit and loss.

Thank for watching our contents. My best regards next day.

© 2025 Retar