2013/07

東京円建て金・トレンドラインでは4300円HIGHから戻り歩調/Tokyo market gold calculated in yen; Going over 4300 yen will be the reversal confirming point. /东京市场的黄金。超过4300日元,将是的转回确认点。

2013/07/07

東京円建て金・トレンドラインでは4300円HIGHから戻り歩調

Tokyo market gold calculated in yen; Going over 4300 yen will be the reversal confirming point.

东京市场的黄金。超过4300日元,将是的转回确认点。


本日は東京円建て金についてです。

Today we analyze Tokyo market gold calculated in yen.

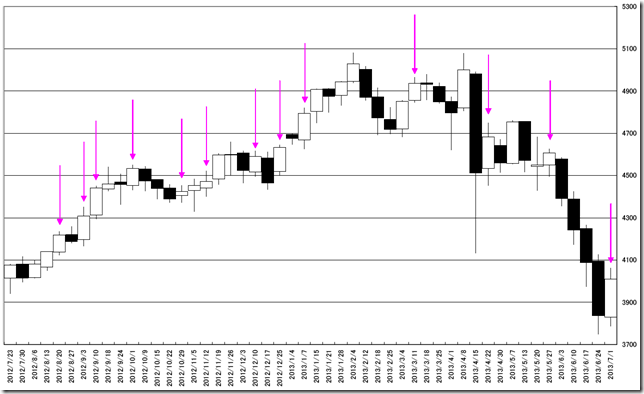
週足線では羽黒2号線となりました。

200週で55回出現しています。

参考にならないのでパス。

In this week, the market price formed “HAGURO” No. 2 formation.

In past 200 weeks, it appeared 55 times.

It does not become helpful.

chart1


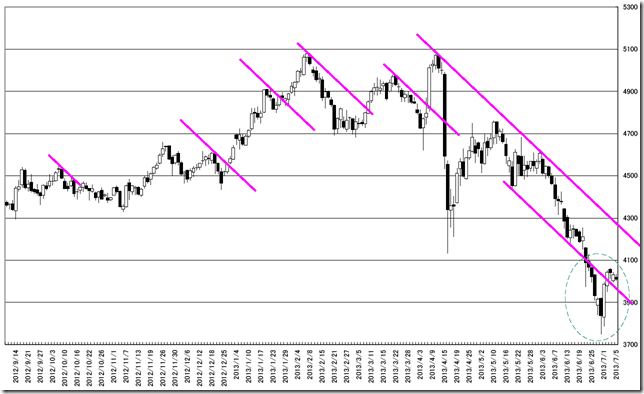
日足トレンドライン分析では、下側に切れており(緑丸)、底打ち感はでていると思います。

2013/05/30レポートで紹介した日経平均の反対パターンです。

Analyzing by daily trend line, the market price cut the pink trend line (Green point) and this often suggests close to the bottom.

This is an opposite pattern of the N225 reported in 2013/05/30.

chart2


相場分析のリクエストがありましたら“Contact Us”からお知らせください。ご要望にお応えできるように努力いたします。

このブログはあくまでも個人的な見解であり、投資判断は各自でお願い致します。当ブログは一切の投資損益に対する責任を負いません。

ホームページに来て下さってありがとうございます。明日もよろしくお願いいたします。

If you have some request to analyze, please write to “Contact Us”.

We do best effort for your request.

These are only personal opinions on this blog, and you need the investment judgment in each one. This blog doesn’t assume the responsibility to all the investment profit and loss.

Thank for watching our contents. My best regards next day.


TOPIX日足・P&Fではサポートが利く/TOPIX (Tokyo stock Price Index) Daily; the support line worked well calculated by P&F. /证综合指数。计算P&F的有效的支撑线。

2013/07/05

TOPIX日足・P&Fではサポートが利く

TOPIX (Tokyo stock Price Index) Daily; the support line worked well calculated by P&F.

证综合指数。计算P&F的有效的支撑线。


本日はTOPIX日足を分析します。

Today we analyze TOPIX daily.

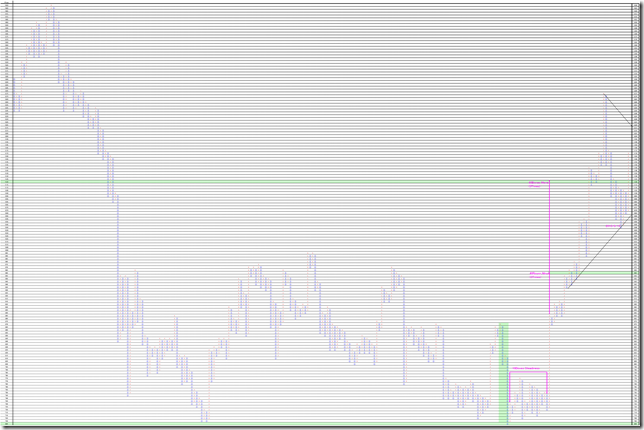
5 point、3枠転換の終値ポイントアンドフィギュアです。

持ち合いからの5倍返しを超えて上昇しています。

強気相場であることが確認できます。

2013/06/13の安値試しも45度線を割り込まずに反転しています。

調整が終わり再上昇する型になっています。

This is 5 point change and 3 box reversal close price’s Point and Figure chart.

The market price went up 5 times over move from 16boxes steadiness.

We can confirm now is bullish market.

And the market price did not cut 45 degree support line in 06/13/2013.

This chart seems to be the starting of bullish market.

CHART


相場分析のリクエストがありましたら“Contact Us”からお知らせください。ご要望にお応えできるように努力いたします。

このブログはあくまでも個人的な見解であり、投資判断は各自でお願い致します。当ブログは一切の投資損益に対する責任を負いません。

ホームページに来て下さってありがとうございます。明日もよろしくお願いいたします。

If you have some request to analyze, please write to “Contact Us”.

We do best effort for your request.

These are only personal opinions on this blog, and you need the investment judgment in each one. This blog doesn’t assume the responsibility to all the investment profit and loss.

Thank for watching our contents. My best regards next day.

© 2025 Retar