2013/10

日経平均週足・2013/10/14の週に要注意/NIKKEI 225 Weekly; We need to watch 10/14/2013 week. /日经225指数。我们需要看2013年10月14日。

2013/10/07

日経平均週足・2013/10/14の週に要注意

NIKKEI 225 Weekly; We need to watch 10/14/2013 week.

日经225指数。我们需要看2013年10月14日。


本日は日経平均週足についてです。

Today’s analyze is NIKKEI 225 weekly.

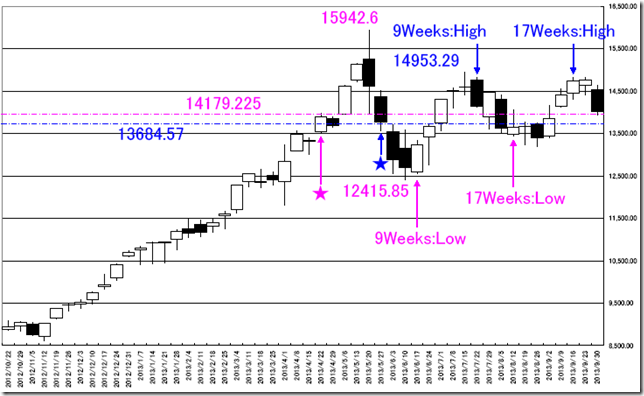
年初来高値と年初来安値に挟まれている現在、離れを見極めるのが定石です。

We need to wait for the launching; the market price is being between the year high and the year low.

半値関係のピンク系列は安値圏。

半値関係の青系列は高値圏。

このように、相場が動いていると考えると「2013/10/14の週は安値圏。2013/11/18の週は高値圏」ではないかとみえます。

この動きから外れるときこそ、離れへの警戒です。

The pink series of the half price points are the low price zone.

The blue series of the half price points are the high price zone.

If the market will go on this relation, 10/14/2013 week will be the low price zone and 11/18/2013 week will be the low price zone.

And if the market price relation will break, this may be the launching.

CHART


相場分析のリクエストがありましたら“Contact Us”からお知らせください。ご要望にお応えできるように努力いたします。

このブログはあくまでも個人的な見解であり、投資判断は各自でお願い致します。当ブログは一切の投資損益に対する責任を負いません。

ホームページに来て下さってありがとうございます。明日もよろしくお願いいたします。

If you have some request to analyze, please write to “Contact Us”.

We do best effort for your request.

These are only personal opinions on this blog, and you need the investment judgment in each one. This blog doesn’t assume the responsibility to all the investment profit and loss.

Thank for watching our contents. My best regards next day.

如果您需要行情分析,请点击“Contact Us”联系我们。我们将尽力满足您的要求。

本博客仅为个人意见,请各自做出投资判断。本博客概不对任何投资盈亏负责。

感谢您访问本博客。欢迎再次使用。


東京円建て金週足・トレンドライン分析・下がるなら3592.5ポイントを意識/Tokyo market gold calculated in yen weekly; if the market price will fall, we need to notice 3592.5 point. /东京市场的黄金。趋势线分析。如果市场价格将下跌,我们需要注意到3592.5点。

2013/10/03

東京円建て金週足・トレンドライン分析・下がるなら3592.5ポイントを意識

Tokyo market gold calculated in yen weekly; if the market price will fall, we need to notice 3592.5 point.

东京市场的黄金。趋势线分析。如果市场价格将下跌,我们需要注意到3592.5点。


本日は東京円建て金週足についてです。

Today we analyze Tokyo market gold calculated in yen weekly.

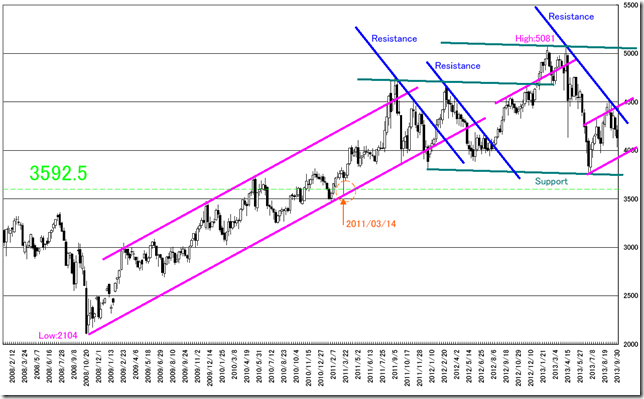
300週のロウソク足です。

安値は2104ポイント、高値は5081ポイントです。

半値は3592.5ポイントです。

3592.5ポイントに水平線(緑)を引いてみると、2011/03/11の週を最後に価格は離れています。

最近も「暴落だ何だ」といっていましたが、「半値も試していない」ともいえます。

強気に戻るきっかけは青のトレンドラインだとみています。

過去にも、このラインを超えて強気がスタートしました。

一度半値を試してくるのか、それとも青いレジスタンスを超えるのかに注目したいと思います。

This is 300 weeks candle stick chart.

The highest is 5081 point and the lowest is 2104 point.

The half price is 3592.5 point.

Drawing the horizontal line at 3592.5 point, the market price ranched in 03/11/2011 week.

We saw the big fall recently, but that fall did not reach the half price.

And the trend reversal signal is cutting blue trend line.

In past market, the bullish market started cutting this line.

We need to watch the market price may challenge 3592.5 point or may cut the blue resistance line suddenly.

CHART


相場分析のリクエストがありましたら“Contact Us”からお知らせください。ご要望にお応えできるように努力いたします。

このブログはあくまでも個人的な見解であり、投資判断は各自でお願い致します。当ブログは一切の投資損益に対する責任を負いません。

ホームページに来て下さってありがとうございます。明日もよろしくお願いいたします。

If you have some request to analyze, please write to “Contact Us”.

We do best effort for your request.

These are only personal opinions on this blog, and you need the investment judgment in each one. This blog doesn’t assume the responsibility to all the investment profit and loss.

Thank for watching our contents. My best regards next day.

如果您需要行情分析,请点击“Contact Us”联系我们。我们将尽力满足您的要求。

本博客仅为个人意见,请各自做出投资判断。本博客概不对任何投资盈亏负责。

感谢您访问本博客。欢迎再次使用。

© 2025 Retar