2014/10

日経225とNY原油の20年間の比較・NY原油価格に対し日経225はかなり割高/Comparing N225 and NY Oil past 20 years; N225 is quite comparatively high-priced to NY Oil. /比较20年间的日经225和西德克萨斯中质油(WTI)。日经225是大大高于西德克萨斯中质油更贵。

2014/10/16

日経225とNY原油の20年間の比較・NY原油価格に対し日経225はかなり割高

Comparing N225 and NY Oil past 20 years; N225 is quite comparatively high-priced to NY Oil.

比较20年间的日经225和西德克萨斯中质油(WTI)。日经225是大大高于西德克萨斯中质油更贵。


本日はRetar.jpで開発した比較INDEXを使い日経225週足とNY原油週足のパフォーマンスについて考えてみます。

結論はNY原油の価格に対して日経225は、1994年以降最も割高になっています。

Today, we use our new type of INDEX and comparing N225 and NY Oil performance.

Our conclusion is N225 is quite comparatively high-priced to NY Oil after 1994.


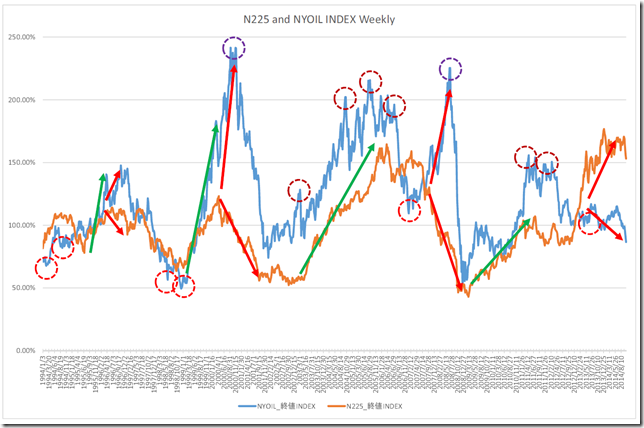
チャートは日経225週足とNY原油週足のINDEXです。

過去の日経225の上昇局面では、1.原油価格の上昇を伴いながら日経225が上昇する局面(緑)と2.日経225だけが上昇し原油価格が下落する局面があることがわかります(赤)。

INDEXからは、現在の状況は2.の状況であることがわかります。

This chart is N225 and NY oil weekly INDEX.

In past jumping market, there were two types; 1. When N255 was jumping, NY Oil followed it (Green) and 2. When N255 was jumping, NY Oil does not follow it (Red).

And now is close to type 2. Occasion.

CHART1


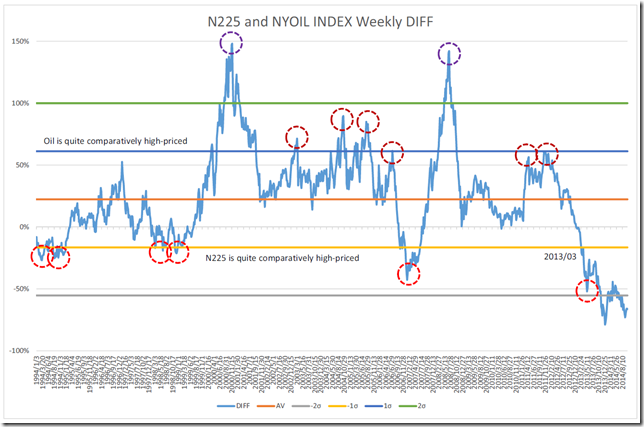
INDEXの差分をチャートにしました。

1σ、-1σを超えたと所からが割安、割高の水準と定義すると、2013/03以降は日経225の割高感が突出しています。

更に注目したいのは1σ、-1σを超えた丸の位置です。

This is subtraction of INDEX chart.

Defining from the value with having exceeded 1sigma and -1sigma as a relatively cheap and comparatively high-priced level, N225 is comparatively high-priced level after 03/2013.

And notable points are circles of a dotted line. (Exceeded 1sigma and -1sigma)

CHART2


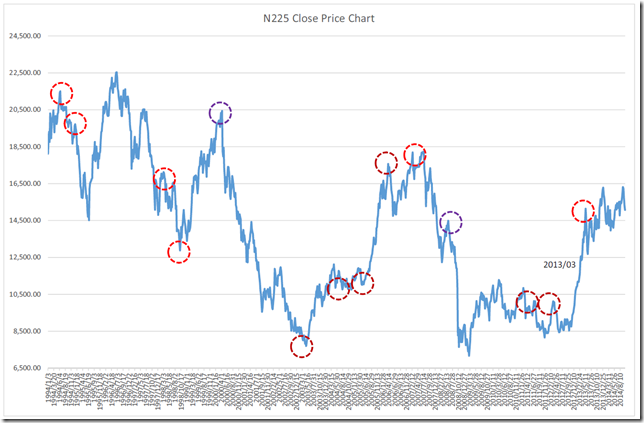
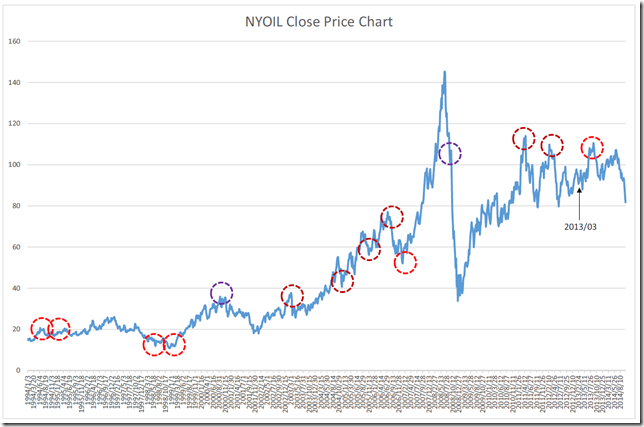
丸の位置を日経平均に重ね合わせると、丸の位置はほぼ相場の天底付近に位置しており、その後、反対方向に向かって動き出してきたことがわかります。

現在の相場の割高な水準が発生したのが、おおよそ2013/03以降になり、相場水準の訂正が発生すると見るのが自然です。

In N225 market, these points were close to peaked out or bottom out points and started against trend.

The start of comparatively high-priced level is after 03/2013 and it is natural to conclude some collection.

CHART3

CHART4


相場分析のリクエストがありましたら“Contact Us”からお知らせください。ご要望にお応えできるように努力いたします。

このブログはあくまでも個人的な見解であり、投資判断は各自でお願い致します。当ブログは一切の投資損益に対する責任を負いません。

ホームページに来て下さってありがとうございます。明日もよろしくお願いいたします。

If you have some request to analyze, please write to “Contact Us”.

We do best effort for your request.

These are only personal opinions on this blog, and you need the investment judgment in each one. This blog doesn’t assume the responsibility to all the investment profit and loss.

Thank for watching our contents. My best regards next day.

如果您需要行情分析,请点击“Contact Us”联系我们。我们将尽力满足您的要求。

本博客仅为个人意见,请各自做出投资判断。本博客概不对任何投资盈亏负责。

感谢您访问本博客。欢迎再次使用。


TOPIXと日経平均日足P&F・日経は崩れ、TOPIXは押し;2004年型に類似/TOPIX (Tokyo stock Price Index) and N225 Daily P&F; N225 was collapsed and TOPIX is still dip; the recent condition is close to 2004. /东证综合指数,和日经225。P&F分析。日经225已倒塌,东证综合指数仍在探底。类似2004年型。

2014/10/15

TOPIXと日経平均日足P&F・日経は崩れ、TOPIXは押し;2004年型に類似

TOPIX (Tokyo stock Price Index) and N225 Daily P&F; N225 was collapsed and TOPIX is still dip; the recent condition is close to 2004.

东证综合指数,和日经225。P&F分析。日经225已倒塌,东证综合指数仍在探底。类似2004年型。


本日はTOPIXと日経225日足を分析します。

Today we analyze TOPIX and N225 daily.


2014/08/16のレポートでは「TOPIXと日経平均日足P&F・崩れるときは共に崩れる(2)」と報告しています。

崩れるというのはTOPIXと日経平均日足のP&Fが45度線を共に割り込むとベアトレンドが開始するという意味です。

We reported “TOPIX (Tokyo stock Price Index) and N225 Daily P&F; if market will collapse, both of them will collapse.(2)” in 08/16/2014.

Collapses means both N225 and TOPIX daily P&F cut 45 degree support and start the bear trend.


2014/08/04のレポートでは「日経平均日足P&F・上昇相場終了のシグナル発生」と報告しました。

また、2014/08/15のレポートでは「TOPIX日足P&F・日経とは異なり強気維持の型」と報告しています。

この時点では、日経平均が弱気シグナルを発生させて、TOPIXはなお押しの範疇を出ていないという現象を発生させ2014/09/25に新高値をつけました。

We reported “NIKKEI 225 Daily; P&F; now will not be a perfect upper side breaking” in 08/04/2014.

And we reported “TOPIX (Tokyo stock Price Index) Daily P&F; this market is different from N225 and keeping bullish” in 08/15/2014.

At this time, N225 made bear trend and TOPIX was still dip and N225 took the year high in 09/25/2014.


現在の状況も非常によく似ており、TOPIXは45度線でサポートされ、日経平均は45度線を割り込んでいます。

2014/08/16のレポートを参考にすると、本日までの状況では2004年型の相場と類似していると結論付けられます。

明日以降、TOPIXが崩れていくかに注目したいと思います。

The latest condition is very similar; TOPIX does not cut 45 degree and N225 cut 45 degree line.

Refers to the report of 08/16/2014, the latest market condition is close to 2004’s market condition.

We need to watch the market price will collapse or not from tomorrow.

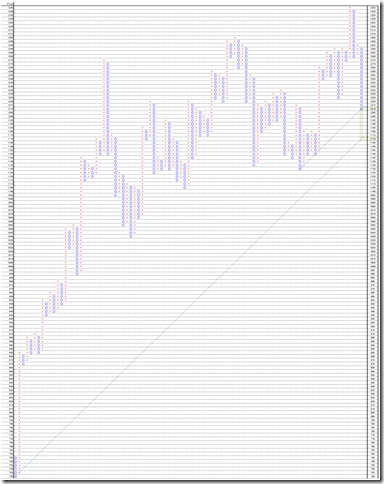
<N225>

N225


<TOPIX>

TOPIX


相場分析のリクエストがありましたら“Contact Us”からお知らせください。ご要望にお応えできるように努力いたします。

このブログはあくまでも個人的な見解であり、投資判断は各自でお願い致します。当ブログは一切の投資損益に対する責任を負いません。

ホームページに来て下さってありがとうございます。明日もよろしくお願いいたします。

If you have some request to analyze, please write to “Contact Us”.

We do best effort for your request.

These are only personal opinions on this blog, and you need the investment judgment in each one. This blog doesn’t assume the responsibility to all the investment profit and loss.

Thank for watching our contents. My best regards next day.

如果您需要行情分析,请点击“Contact Us”联系我们。我们将尽力满足您的要求。

本博客仅为个人意见,请各自做出投资判断。本博客概不对任何投资盈亏负责。

感谢您访问本博客。欢迎再次使用。

© 2025 Retar