2014/10

日経平均週足・トレンドライン分析・長期上昇トレンド終了の可能性大/NIKKEI 225 Weekly; Trend line; Long term Bull market must have already ended. /日经225。趋势线分析。已經长期牛市說不定结束。

2014/10/14

日経平均週足・トレンドライン分析・長期上昇トレンド終了の可能性大

NIKKEI 225 Weekly; Trend line; Long term Bull market must have already ended.

日经225。趋势线分析。已經长期牛市說不定结束。


本日は日経平均週足についてです。

2014/10/09で紹介した「2014/10/09は2014/09/02からの26営業日にあたり、昨日より終値が15668.6円より下にあるため、弱気のシグナルが発生しています。」のとおりになりました。
また同日のレポートでは「15353.33円付近の反発が確認できなければ、一気に14963.06円近傍までの下げを考慮する必要が発生します。」ともコメントしています。

本日の相場では、終値14,936.51円でその差-26.55円となり、誤差のうちとなりました。

Today’s analyze is NIKKEI 225 weekly.

We reported “10/09/2014 is the 26 business days from 09/02/2014 and the market close price is under 15668.6yen; this means bearish signal”.
And this report said “If the market price will not recover 15353.33yen around, the market price may fall straight to 14963.06yen around”.

Today’s close price was 14,936.51yen and the difference was -26.55 yen.

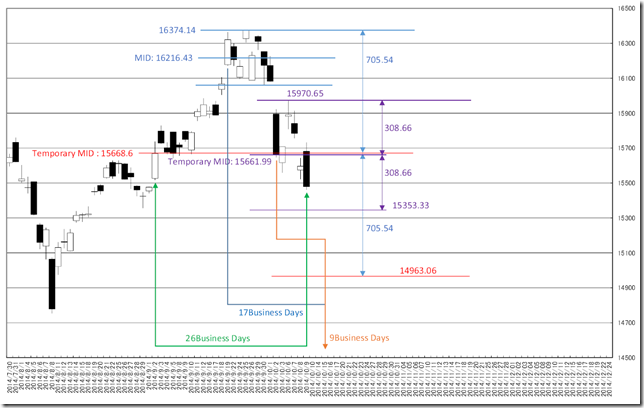
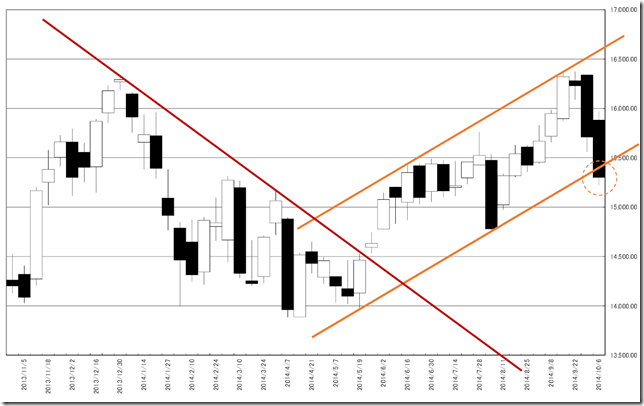
まずはじめの確認は、現在はチャネルブレーク。

下値模索の型であるようなのは確かです。

First, we need to see now is channel breaking and seeking for the bottom.

CHART1


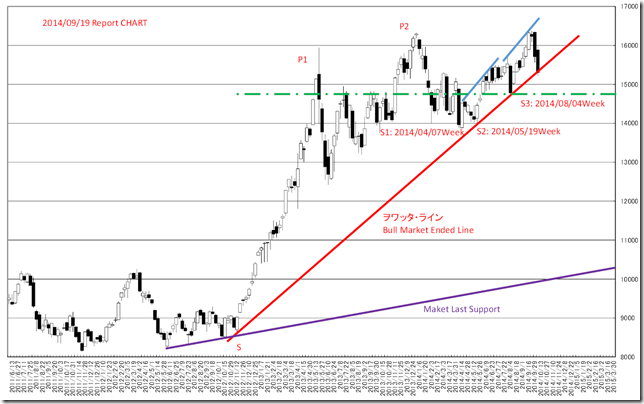
2014/09/19のレポートでは「なお上値余地」について紹介しました。

この時点で「ヲワッタ・ライン」を設定しましたが、相場は予定していたラインを割り込んだため、強気相場は終了です。

この時点で想定していたS1は2014/05/19の週でした。

この時点では終値が「ヲワッタ・ライン」を割り込むことは想定しておらず、ヒゲを残して反発するなどを想定していました。

We reported “There are some room for jumping” in 09/19/2014.

And we set “Bull Market Ended Line” and the market price cut it and this means bull market has already ended.

At that time, we set “S1” point as 05/19/2014 week.

And we did not suppose “the market price will not cut the ’Bull Market Ended Line’ and recover.

CHART2


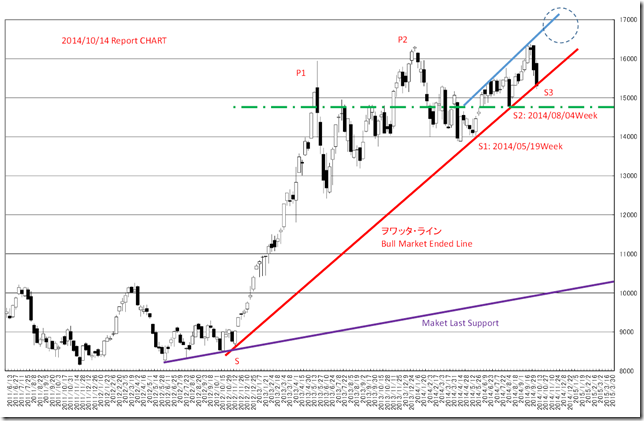
しかし、「ヲワッタ・ライン」を割り込んでしまったため、S1の地点はこれ以前の2014/04/21の週であった可能性があります。

2014/09/25の高値は年初来高値であったため、既にパターンは完成しており、上昇相場は終わっていると見るべきだと展望を変更します。

But the market price has already cut “Bull Market Ended Line” and this means “S1” point was 04/21/2014 week.

09/25/2014 was year high and the market formation was completed and we need to start bearish market was started.

CHART3


「いいや、まだ上値はある」と思う参加者は、緑の線が最後通牒になります。

下落トレンド入りは濃厚ですが、両チャートでも前回安値を割り込む型となります。2014/08/04の週の終値14753.84円が最後の希望としておきましょう。

Some market attendants may think “there are some room for jumping”.

There is a common limit; Green line will be the ultimatum.

We think now is very close to the start of the bear market and cutting Green line means that cutting the last low in both charts.

We set “The last hope” and this is 14753.84yen. (08/04/2014 week low)


相場分析のリクエストがありましたら“Contact Us”からお知らせください。ご要望にお応えできるように努力いたします。

このブログはあくまでも個人的な見解であり、投資判断は各自でお願い致します。当ブログは一切の投資損益に対する責任を負いません。

ホームページに来て下さってありがとうございます。明日もよろしくお願いいたします。

If you have some request to analyze, please write to “Contact Us”.

We do best effort for your request.

These are only personal opinions on this blog, and you need the investment judgment in each one. This blog doesn’t assume the responsibility to all the investment profit and loss.

Thank for watching our contents. My best regards next day.

如果您需要行情分析,请点击“Contact Us”联系我们。我们将尽力满足您的要求。

本博客仅为个人意见,请各自做出投资判断。本博客概不对任何投资盈亏负责。

感谢您访问本博客。欢迎再次使用。


日経平均日足・変化日は2014年10月15日。サポート15353.33円近傍に注目/NIKKEI 225 Daily; “HENKABI” is 10/15/2014; we need to see 15353.33yen around will work as support or not. /日经225。“变化日” 是2014年10月15日。注意15353.33日元左右的支持。

2014/10/09

日経平均日足・変化日は2014年10月15日。サポート15353.33円近傍に注目

NIKKEI 225 Daily; “HENKABI” is 10/15/2014; we need to see 15353.33yen around will work as support or not.

日经225。“变化日” 是2014年10月15日。注意15353.33日元左右的支持。


本日は日経平均日足についてです。

Today’s analyze is NIKKEI 225 daily.


2014/09/18のレポートでは「日経平均日足・既に持ち合いかも?2014/09/25の動きに注目」としていました。

2014/09/25に高値を付けたため、相場と起点となる日は、ほぼ間違いなく2014/09/02であることが確認できました。

また、2014/10/09は2014/09/02からの26営業日にあたり、昨日より終値が15668.6円より下にあるため、弱気のシグナルが発生しています。

今後のメジャーサポートは14963.06円近傍、メジャーなレジスタンスは15668.6円近傍となるでしょう。

しかし、相場が一方向きで下げていくというのは考えづらく、波動を伴って下げていくはずです。

短期的な持ち合いとしては、2014/09/14、2014/10/02を起点とした持ち合いです。

直近の底値試しは、2014/09/14からの17営業日、2014/10/02からの9営業日にあたる2014/10/15に15353.33円近傍を試す可能性が高いとみています。

15353.33円付近の反発が確認できなければ、一気に14963.06円近傍までの下げを考慮する必要が発生します。

We reported “NIKKEI 225 Daily; now may be a steadiness; we need to watch after 09/25/2014” in 09/18/2014.

The market price took high in 09/25/2014; this means 09/02/2014 must be the important market starting point.

And 10/09/2014 is the 26 business days from 09/02/2014 and the market close price is under 15668.6yen; this means bearish signal.

We estimate the major support will be 14963.06yen and the major resistance will be 15668.6yen around.

But one direction trend will be difficult; the market price will be short recover and fall.

The candidates of starting are 09/14/2014 and 10/02/2014.

We need to confirm the market price will challenge 15353.33yen around in 10/15/2014. (17 business days from 09/14/2014 and 9 business days from 10/02/2014)

If the market price will not recover 15353.33yen around, the market price may fall straight to 14963.06yen around.

CHART


相場分析のリクエストがありましたら“Contact Us”からお知らせください。ご要望にお応えできるように努力いたします。

このブログはあくまでも個人的な見解であり、投資判断は各自でお願い致します。当ブログは一切の投資損益に対する責任を負いません。

ホームページに来て下さってありがとうございます。明日もよろしくお願いいたします。

If you have some request to analyze, please write to “Contact Us”.

We do best effort for your request.

These are only personal opinions on this blog, and you need the investment judgment in each one. This blog doesn’t assume the responsibility to all the investment profit and loss.

Thank for watching our contents. My best regards next day.

如果您需要行情分析,请点击“Contact Us”联系我们。我们将尽力满足您的要求。

本博客仅为个人意见,请各自做出投资判断。本博客概不对任何投资盈亏负责。

感谢您访问本博客。欢迎再次使用。

© 2025 Retar