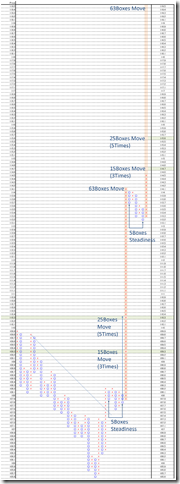
ドル円1時間P&F。レジスタンス114.70円、115.60円、119.50円
Dollar/Yen hourly P&F; Resistance point will be 114.50yen, 115.60yen and 119.50yen.
美元/日元。P&F分析。阻力点会114.50日元、115.60日元、和119.50日元。
本日はドル円1時間足についてです。
今後のレジスタンスポイントも大切ですが、大相場でどのように動いたのか記憶しておくこともとても大切です。
Today, we analyze USDJPY hourly.
Resistance points will be important and we need to record this big jump for future market.
1枠0.1円、3枠転換の終値ポイントアンドフィギュアです。
1時間足を使用しオセアニア時間帯を省いています。
直近の相場では、レジスタンスは114.70円、115.60円119.50円となります。
This is 0.1 price change and 3 box reversal close price’s Point and Figure chart.
We used hourly data and the Oceania time zone market price is pulled out.
Latest market, the resistance points will be 114.70yen, 115.60yen and 119.50yen.
大相場について考えてみたいと思います。
大相場では、いきなり63枠縦方向に動いたマーケットとなりました。
63枠というのは、今後も「持ちあいなしにいきなり動く値」として、記憶しておく必要があります。
裏を返せば、P&Fの1時間足のレジスタンスポイントが無意味であったようにみえることです。
Retar.jpが使用している1時間足は、ある業者が出力する1時間毎の終値です。
大相場の前は、Retar.jpでは「レジスタンスポイント109.30円、110.30円」と出していました。
しかし、今回、大きな値動きがあったので、Retar.jpが使用しているP&Fには記録として表れていませんでした。
Now, we remind the big deal.
In this big deal, the market price moved 63 boxes in one direction.
63 boxes will be great meaning in future; this will be the biggest moving without steadiness.
And this seems our P&F is no meaning.
Our P&F chart is the data of some FX dealer’s price.
Our offering P&F can only plot 1 time in 1 hour.
Before the start of this big market, we must have offered “The resistance points are 109.30yen and 110.30yen”.
And we cannot use this P&F chart in this market.
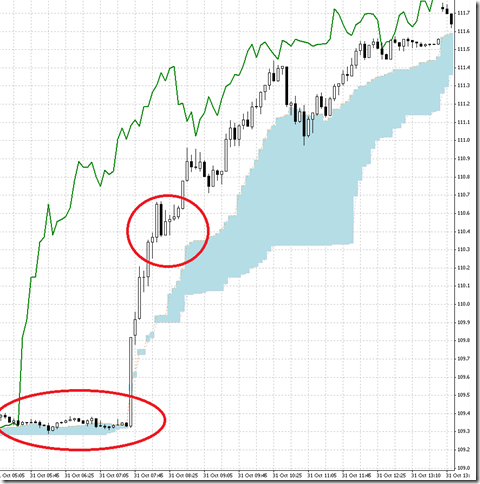
チャートは5分足です。
5分足を詳細にみていくと、1時間足の使いたかが見えてきます。
This is 5 mints chart.
Precise seeing 5 minutes chart, we can know how to use hourly P6F chart.
1. 大相場が始まる直前は109.30-40円のレジスタンスポイントにいました。
本来なら反落する地点です。
しかし、大相場の開始直後、109.30-40円はあっさり抜けます。
Before starting this big market, the market price is being the upper side resistance limit (109.30-40yen).
In normal occasion, this market must have felled.
2. 抜けたのであれば、110.30-40円で止まることを想定して、相場を見ていきます。
しかし、110.30-40円は、抜けた後にサポートとして、機能して相場をサポートしています。
Cutting this point, we can estimate 110.30-40 will work.
But cutting 110.30-40yen, this point worked as support.
ここから先は1時間足のP&Fが機能不全に陥り、より大きな時間枠のP&Fが機能してくる局面となりました。
今後の相場に応用できるデータとして記憶していきたいと思います。
After this, hourly P&F had no meaning and we needed big time frame chart.
This big market gave us good experience.
相場分析のリクエストがありましたら“Contact Us”からお知らせください。ご要望にお応えできるように努力いたします。
このブログはあくまでも個人的な見解であり、投資判断は各自でお願い致します。当ブログは一切の投資損益に対する責任を負いません。
ホームページに来て下さってありがとうございます。明日もよろしくお願いいたします。
If you have some request to analyze, please write to “Contact Us”.
We do best effort for your request.
These are only personal opinions on this blog, and you need the investment judgment in each one. This blog doesn’t assume the responsibility to all the investment profit and loss.
Thank for watching our contents. My best regards next day.
如果您需要行情分析,请点击“Contact Us”联系我们。我们将尽力满足您的要求。
本博客仅为个人意见,请各自做出投资判断。本博客概不对任何投资盈亏负责。
感谢您访问本博客。欢迎再次使用。

