2014/11

TOPIX日足;衆院解散の影響を比較;出足が悪く下落する可能性が高い/TOPIX (Tokyo stock Price Index) Daily; Comparing the impact of dissolution of the House of Representatives; starting dash is weak and it will be bearish. /东证综合指数。比较众议院解散的影响。起跑弱。这将是看跌。

2014/11/28

TOPIX日足;衆院解散の影響を比較;出足が悪く下落する可能性が高い

TOPIX (Tokyo stock Price Index) Daily; Comparing the impact of dissolution of the House of Representatives; starting dash is weak and it will be bearish.

东证综合指数。比较众议院解散的影响。起跑弱。这将是看跌。


本日はTOPIX日足についてです。

2014/11/19日経新聞朝刊18面では、『「解散は買い」の死角』について、検証がなされておりました。

この記事で紹介されていた衆院解散日は過去13回。

衆院解散日から、Retar INDEXを使い、どのように動いたのかを検証します。

Today’s analyze is TOPIX daily.

Nikkei newspaper article in 11/19/2014 referred to “Impact of dissolution in blind spot”.

In this article, they referred to 13 times dissolution of the House of Representatives.

We verify using our Retar INDEX.


1990年以降のデータを使いTOPIXを分析しています。

今回を含め解散は8回。

今後を想定する上で、解散というイベントに対するモメンタムが続くとみる分析が有効だとみています。

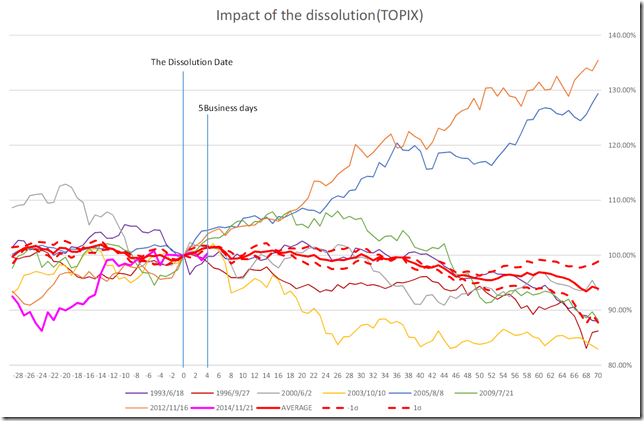
過去の値動きのチャートに重ねてみると、日経平均と同様(2014/11/22レポート参照)に初動5日間は重要な岐路となりそうです。

We analyze TOPIX using daily data after 1990.

Including this time, dissolution was 8 times.

Applying this to the past price chart, the first 5 business days from dissolution is very important. (Similar to N225; see 11/22/2014 report)

CHART1


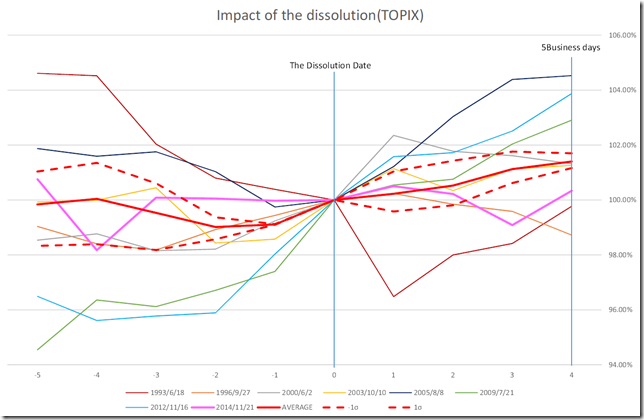
解散初動を拡大してみると、さらにハッキリします。

今回の解散の初動パフォーマンスは悪く、今回の解散ではアンダーパフォームする可能性が高いとみています。

Focus on the first 5 days, it can become clear.

The first performance in this time is weak and the market will be bearish or steadiness.

CHART2


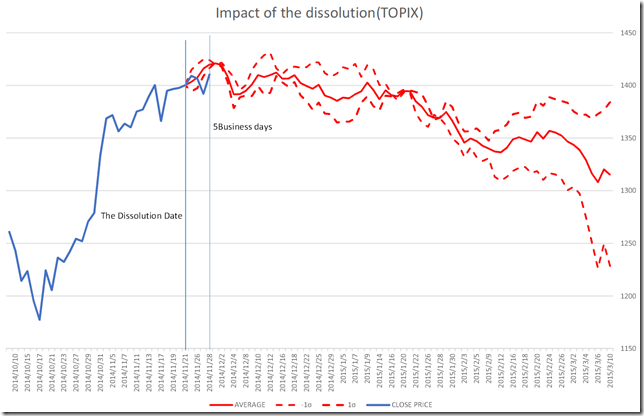
実際の値動きに当てはめると、今後は1σ近傍が売りポイントとして機能しそうです。

データ数が少ないため、モデルの信頼区間は10日営業日前後です。

Applying the proper market price, 1 sigma around will work as resistance.

The data was so few and the reliable zone is about 10 business days around.

CHART3


相場分析のリクエストがありましたら“Contact Us”からお知らせください。ご要望にお応えできるように努力いたします。

このブログはあくまでも個人的な見解であり、投資判断は各自でお願い致します。当ブログは一切の投資損益に対する責任を負いません。

ホームページに来て下さってありがとうございます。明日もよろしくお願いいたします。

If you have some request to analyze, please write to “Contact Us”.

We do best effort for your request.

These are only personal opinions on this blog, and you need the investment judgment in each one. This blog doesn’t assume the responsibility to all the investment profit and loss.

Thank for watching our contents. My best regards next day.

如果您需要行情分析,请点击“Contact Us”联系我们。我们将尽力满足您的要求。

本博客仅为个人意见,请各自做出投资判断。本博客概不对任何投资盈亏负责。

感谢您访问本博客。欢迎再次使用。


日本10年債利回り日足・P&F・ペナントからの下方ブレーク・ターゲット0.41、0.37point/Japanese Government Bonds 10-Year Daily; P&F; breaking from pennant formation and the target is 0.41 and 0.37point. /日本10年国债收益率。P&F分析。从幡形成突破。目标是0.41点和0.37点。

2014/11/27

日本10年債利回り日足・P&F・ペナントからの下方ブレーク・ターゲット0.41、0.37point

Japanese Government Bonds 10-Year Daily; P&F; breaking from pennant formation and the target is 0.41 and 0.37point.

日本10年国债收益率。P&F分析。从幡形成突破。目标是0.41点和0.37点。


山高く、谷深し

本日は、日本10年債利回り日足の分析です。

Peak will go higher, it will tumble over.

Today, we analyze Japanese Government Bonds 10-Year Daily.


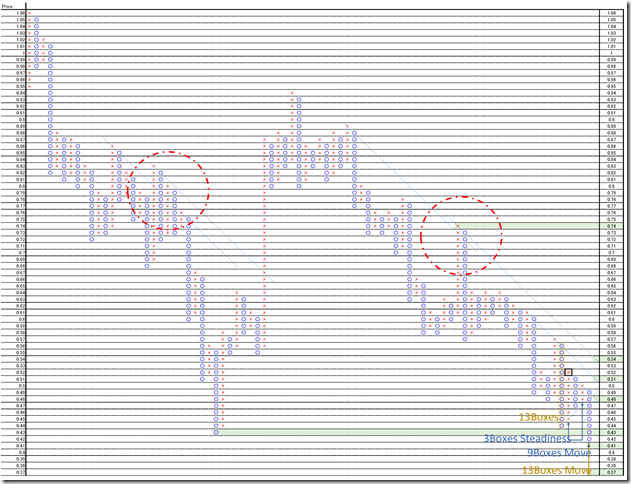
1枠0.01ポイント、3枠転換の終値ポイントアンドフィギュアです。

私たちは「ダブルボトムの模様、急騰の始まりは0.64ポイント超え」と報告しています。(ピンクの枠の地点、2014/11/13レポート

一旦の底をとり、相場はペナントを形成しました。

ペナント形成後は下抜けしており、ターゲットは0.41pointとなります。(3枠持ちわい9枠移動)

また、直近の垂直移動は13枠となるため、更に下の0.37pointもターゲットになります。

レジスタンスポイントは、0.43point、0.48point、0.51point、0.54pointなどです。

ターゲット算出は上方向に抜けてから計算しても遅くはないとみています。

This is 0.01 price change and 3 box reversal close price’s Point and Figure chart.

We reported “The market price has already took double dip and a sharp jump will start 0.64 point over”. (Pink box and see 11/13/2014 report)

The market price took double dip at this point around and make the pennant formation.

After making this formation, the market price broke down side and the target price is 0.41 point. (3 boxes steadiness and 9 boxes move)

And the latest big move was 13 box; the target price may be 0.37 point.

The resistance will be 0.43, 0.48, 0.51 and 0.54 point will work as the resistance point.

We will calculate after breaking it.


注目しているのは、赤丸です。

P&Fでは、よくあることで、一旦ブレークしたように見せかけて、下方向にドッカーンと下げるパターンです。

こういう地点で注視しなくていけないのは、経験的にいつか必ず上がってくると意識するべきポイントになっています。

Our best watching point is red circle.

This is often causing occasion in P&F; the market price went up side once and seemed to be the up side breaking but only became a fake.

We need to remind the market price will come back this point in future empirically.

CHART


相場分析のリクエストがありましたら“Contact Us”からお知らせください。ご要望にお応えできるように努力いたします。

このブログはあくまでも個人的な見解であり、投資判断は各自でお願い致します。当ブログは一切の投資損益に対する責任を負いません。

ホームページに来て下さってありがとうございます。明日もよろしくお願いいたします。

If you have some request to analyze, please write to “Contact Us”.

We do best effort for your request.

These are only personal opinions on this blog, and you need the investment judgment in each one. This blog doesn’t assume the responsibility to all the investment profit and loss.

Thank for watching our contents. My best regards next day.

如果您需要行情分析,请点击“Contact Us”联系我们。我们将尽力满足您的要求。

本博客仅为个人意见,请各自做出投资判断。本博客概不对任何投资盈亏负责。

感谢您访问本博客。欢迎再次使用。

© 2024 Retar