日経平均日足・衆院解散の影響を比較 その3・来週末17900円超えか、17300円割れになると大相場の予感
NIKKEI 225 daily; Comparing the impact of dissolution of the House of Representatives Part 3; Cutting over 17900yen or 17300yen in next weekend close price will be a big deal.
日经225。比较众议院解散的影响。第3部。要是17900日元多或下周末收盘价17300日元,就将是一个大不了。
本日は日経平均日足についてです。
2014/11/19日経新聞朝刊18面では、『「解散は買い」の死角』について、検証がなされておりました。
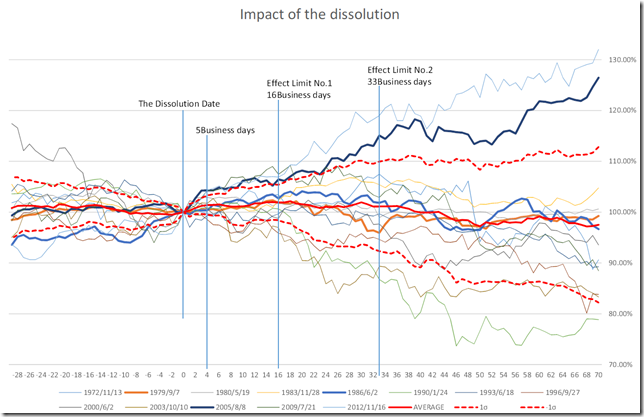
この記事で紹介されていた衆院解散日は過去13回。
衆院解散日から、Retar INDEXを使い、どのように動いたのかを検証します。
Today’s analyze is NIKKEI 225 daily.
Nikkei newspaper article in 11/19/2014 referred to “Impact of dissolution in blind spot”.
In this article, they referred to 13 times dissolution of the House of Representatives.
We verify using our Retar INDEX.
いよいよ、解散日の終値17357.51円が決定しました。
今後を想定する上で、解散というイベントに対するモメンタムが続くとみる分析が有効だとみています。
過去の値動きのチャートに重ねてみると、初動5日間は重要な岐路となります。
初動の5日間で、値動きが1σを超えてくると上昇モメンタムは続きます。
また、初動の5日間で1σを超えられないと、いわゆる「オワッタ」となりやすく、持ち合いから下落傾向となります。
初動の5日間で-1σを下回ってくると、解散後の下げ足を速める結果となり、下降モメンタムが続くことになりやすい。
Now, the close price of dissolution day determined 17357.51yen.
Assuming in future, we think the dissolution impact keep for some time; this event provides some momentum.
Applying this to the past price chart, the first 5 business days from dissolution is very important.
Going over one sigma in the first 5 business day will mean the start of the bull market.
And cannot go over one sigma in the first 5 business day will mean steadiness or falling.
Not go over minus one sigma in the first 5 business day will mean the start of the bear market.
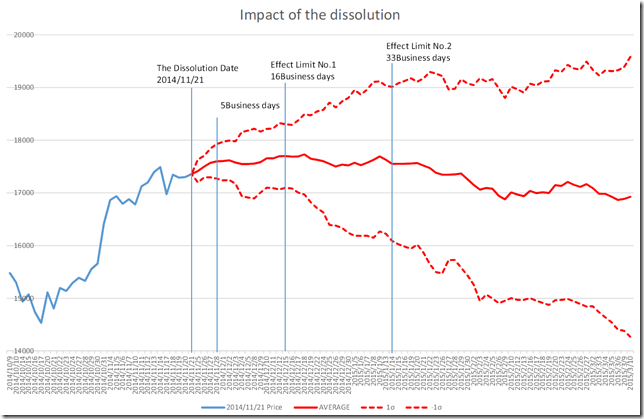
では、2014/11/21の終値17357.51円に対しモデリングすると、来週末(2014/11/28)の終値の1σは17926円、-1σは17271円。
このモデルの限界は33営業日となり2015/1/15までが想定の限界です。(2014/11/19レポート参照)
上昇モメンタムに乗ると、想定限界に近くなりますが、年明けには19000円を探る動きとなりそうです。
もちろん、過去には「多少上げたけど」程度の、もみ合いであったことがほとんどです。
一方、下降モメンタムに乗った実績もあり、その場合、年明けには16000円割れとなりそうです。
Now, last weekend close price was 17357.51yen and applying this.
We can calculate the next weekend close price (11/28/2014) are 17926yen (one sigma) and 17271yen (minus one sigma).
This model end is 33 business days. (See 11/19/2014 report)
If the market will be powerful bull, the market price will be 19000yen over at the beginning of the next year.
In past occasions, most cases are short bit bull market and became steadiness.
We need to remind this event made bear market kick; applying this, the market price will cut 16000yen at the beginning of the next year.
相場分析のリクエストがありましたら“Contact Us”からお知らせください。ご要望にお応えできるように努力いたします。
このブログはあくまでも個人的な見解であり、投資判断は各自でお願い致します。当ブログは一切の投資損益に対する責任を負いません。
ホームページに来て下さってありがとうございます。明日もよろしくお願いいたします。
If you have some request to analyze, please write to “Contact Us”.
We do best effort for your request.
These are only personal opinions on this blog, and you need the investment judgment in each one. This blog doesn’t assume the responsibility to all the investment profit and loss.
Thank for watching our contents. My best regards next day.
如果您需要行情分析,请点击“Contact Us”联系我们。我们将尽力满足您的要求。
本博客仅为个人意见,请各自做出投资判断。本博客概不对任何投资盈亏负责。
感谢您访问本博客。欢迎再次使用。


