2014/11

日経平均日足・衆院解散の影響を比較 その2・直近の値動きからすると2014/12/15以降の動きに注目/NIKKEI 225 daily; Comparing the impact of dissolution of the House of Representatives Part 2; Comparing the latest price moving, we need to watch after 12/15/2014. /日经225。比较众议院解散的影响。第2部。比较最新价格动,我们需要2014年12月15日以后观看。

2014/11/20

日経平均日足・衆院解散の影響を比較 その2・直近の値動きからすると2014/12/15以降の動きに注目

NIKKEI 225 daily; Comparing the impact of dissolution of the House of Representatives Part 2; Comparing the latest price moving, we need to watch after 12/15/2014.

日经225。比较众议院解散的影响。第2部。比较最新价格动,我们需要2014年12月15日以后观看。


本日は日経平均日足についてです。

2014/11/19日経新聞朝刊18面では、『「解散は買い」の死角』について、検証がなされておりました。

この記事で紹介されていた衆院解散日は過去13回。

衆院解散日から、Retar INDEXを使い、どのように動いたのかを検証します。

Today’s analyze is NIKKEI 225 daily.

Nikkei newspaper article in 11/19/2014 referred to “Impact of dissolution in blind spot”.

In this article, they referred to 13 times dissolution of the House of Representatives.

We verify it using our Retar INDEX.


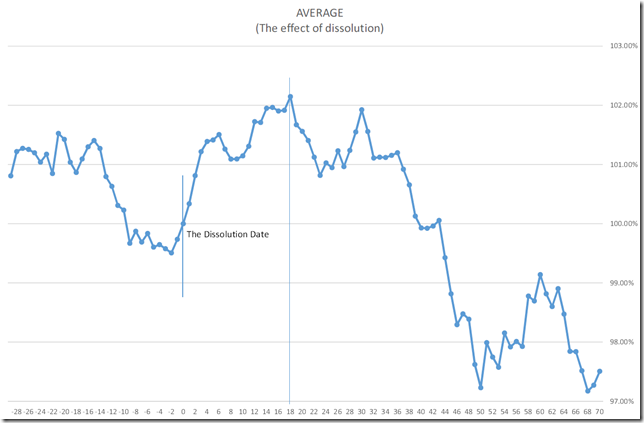
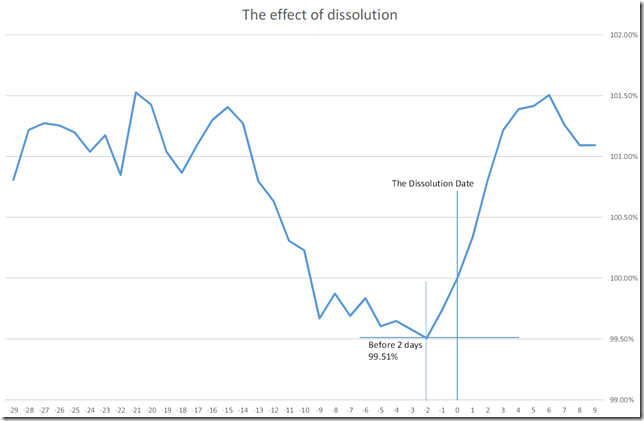
平均値を調査すると、衆院解散2日前に安値を付けるのが一般的なようです。

昨日の終値は今後の基準になる価格なので注目したいと思います。

Analyzing the average, the market price takes the lowest before 2 days of the dissolution of the House of Representatives.

Last day’s close price will be the important close price and we need to watch it.

CHART1


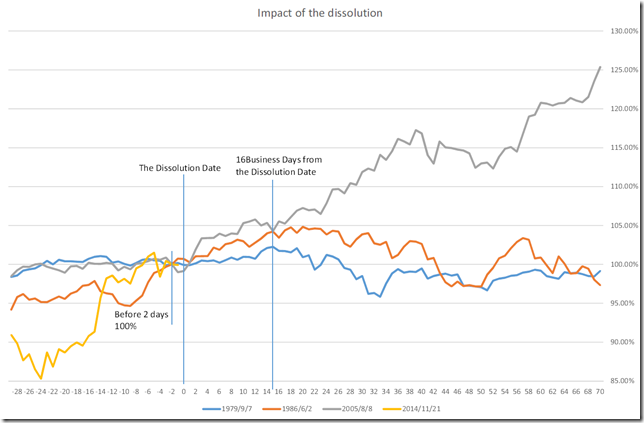
ここで過去の値動きと似た動きをした相場を探しました。

2014/11/21解散と相関関係を持っていたのは、1979/9/7、1986/6/2、2005/8/8でした。(似ていると言っても、なんとなく上がっているようなイメージ)

こうした相場の特徴を今回の相場でも引き継ぐようなら、16営業日までは伸びが期待でき、そこからは方向性が見えなくなる傾向があります。

今回の相場に当てはめると2014/12/15以降の値動きが注目点になります。

We compare the past price moving and find out similar market price moving.

1979/9/7, 1986/6/2 and 2005/8/8 have 2014/11/21 positive correlation.

(Similar market price moving means as somehow going up.)

If the latest market will follow this character, the latest market keep going up until 16 business days and cannot find out its character after that.

Applying this tendency to the latest market, we need to notice 12/15/2014.

CHART2


相場分析のリクエストがありましたら“Contact Us”からお知らせください。ご要望にお応えできるように努力いたします。

このブログはあくまでも個人的な見解であり、投資判断は各自でお願い致します。当ブログは一切の投資損益に対する責任を負いません。

ホームページに来て下さってありがとうございます。明日もよろしくお願いいたします。

If you have some request to analyze, please write to “Contact Us”.

We do best effort for your request.

These are only personal opinions on this blog, and you need the investment judgment in each one. This blog doesn’t assume the responsibility to all the investment profit and loss.

Thank for watching our contents. My best regards next day.

如果您需要行情分析,请点击“Contact Us”联系我们。我们将尽力满足您的要求。

本博客仅为个人意见,请各自做出投资判断。本博客概不对任何投资盈亏负责。

感谢您访问本博客。欢迎再次使用。


日経平均日足・衆院解散の影響を比較 その1・過去の平均値では2014/12/18にピークアウト/NIKKEI 225 daily; Comparing the impact of dissolution of the House of Representatives Part 1; Applying the past average, the market price will peak out in 12/18/2014. /日经225。比较众议院解散的影响。第1部。利用过去平均水平,市场价格将达到顶峰在2014年12月18日。

2014/11/19

日経平均日足・衆院解散の影響を比較 その1 ・過去の平均値では2014/12/18にピークアウト

NIKKEI 225 daily; Comparing the impact of dissolution of the House of Representatives Part 1; Applying the past average, the market price will peak out in 12/18/2014.

日经225。比较众议院解散的影响。第1部。利用过去平均水平,市场价格将达到顶峰在2014年12月18日。


本日は日経平均日足についてです。

2014/11/19日経新聞朝刊18面では、『「解散は買い」の死角』について、検証がなされておりました。

この記事で紹介されていた衆院解散日は過去13回。

衆院解散日から、Retar INDEXを使い、どのように動いたのかを検証します。

Today’s analyze is NIKKEI 225 daily.

Nikkei newspaper article in 11/19/2014 referred to “Impact of dissolution in blind spot”.

In this article, they referred to 13 times dissolution of the House of Representatives.

We verify using our Retar INDEX.


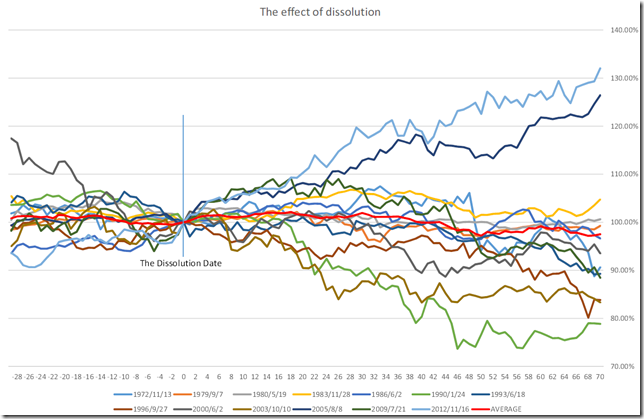
はじめに「解散は買い」か、という基本的な点について見ていくと、解散しても株価が冴えないことも過去には散見されています。

チャートからは「解散は買い」が当てはまるときと当てはまらない時があることがわかります。

First, we need to verify the saying “Dissolution of the House of Representatives is BUY” and this is not necessarily applied.

We can know there were bad occasions in past market.

70


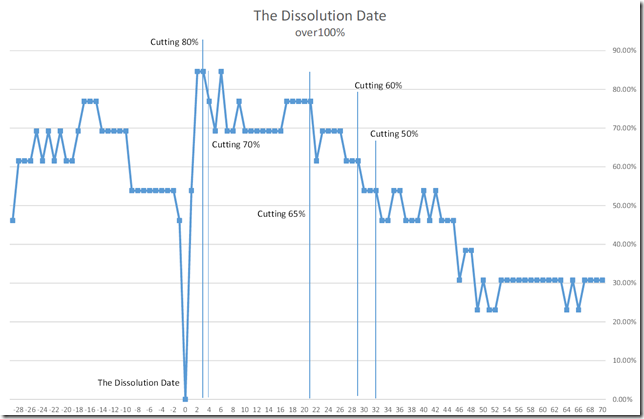
解散日の終値を100%として、値持ちしている日数を検証すると100%確実に値上がりするものではありません。

33営業日までは値持ちしていることが多い(50%超え)とわかります。

33営業日以降は解散の影響は薄れていくと考えられます。

This saying is not a perfect saying.

During 33 business days after dissolution, the market price keeps dissolution day’s close price over in 50% over occasions.

We can know the dissolution impact disappear after business 33days.

Effect


解散後の値動きの平均をとってみると、平均値では19営業日で高値をつけることがわかります。

今回の解散日は2014/11/21です。

19営業日というのは、2014/12/18です。

2014/11/09のレポートでは、「日経平均日足・金融緩和の影響を比較・現在に当てはめると初押しは買い、2014/12/15-17に利食い」としています。

この付近の天井の可能性が高まっているとみています。

Taking the average, the market highest price takes 19 business days.

The dissolution date is 11/21/2014 and 19 business days is 12/18/2014.

We reported “NIKKEI 225 daily; Comparing to past Monetary Easing; Apply to the latest market, buy in dip and take profit from 12/15/2014 to 12/17/2014”. In 11/09/2014.

We can know the market price will peak out this time around.

AV


相場分析のリクエストがありましたら“Contact Us”からお知らせください。ご要望にお応えできるように努力いたします。

このブログはあくまでも個人的な見解であり、投資判断は各自でお願い致します。当ブログは一切の投資損益に対する責任を負いません。

ホームページに来て下さってありがとうございます。明日もよろしくお願いいたします。

If you have some request to analyze, please write to “Contact Us”.

We do best effort for your request.

These are only personal opinions on this blog, and you need the investment judgment in each one. This blog doesn’t assume the responsibility to all the investment profit and loss.

Thank for watching our contents. My best regards next day.

如果您需要行情分析,请点击“Contact Us”联系我们。我们将尽力满足您的要求。

本博客仅为个人意见,请各自做出投资判断。本博客概不对任何投资盈亏负责。

感谢您访问本博客。欢迎再次使用。

© 2025 Retar