2014/12

日経平均日足・衆院解散の影響を比較 その6・解散後の相場はバブル崩壊の1990年相場と似る/NIKKEI 225 daily; Comparing the impact of dissolution of the House of Representatives Part 6; now is very similar to 1990’s market, Oh! It was corrupted year! /日经225。比较众议院解散的影响。第6部。现在非常相似,1990年的市场。啊!它被破坏的年!

2014/12/12

日経平均日足・衆院解散の影響を比較 その6・解散後の相場はバブル崩壊の1990年相場と似る

NIKKEI 225 daily; Comparing the impact of dissolution of the House of Representatives Part 6; now is very similar to 1990’s market, Oh! It was corrupted year!

日经225。比较众议院解散的影响。第6部。现在非常相似,1990年的市场。啊!它被破坏的年!


本日は日経平均日足についてです。

2014/11/19日経新聞朝刊18面では、『「解散は買い」の死角』について、検証がなされておりました。

この記事で紹介されていた衆院解散日は過去13回。

衆院解散日から、Retar INDEXを使い、どのように動いたのかを検証します。

Today’s analyze is NIKKEI 225 daily.

Nikkei newspaper article in 11/19/2014 referred to “Impact of dissolution in blind spot”.

In this article, they referred to 13 times dissolution of the House of Representatives.

We verify using our Retar INDEX.


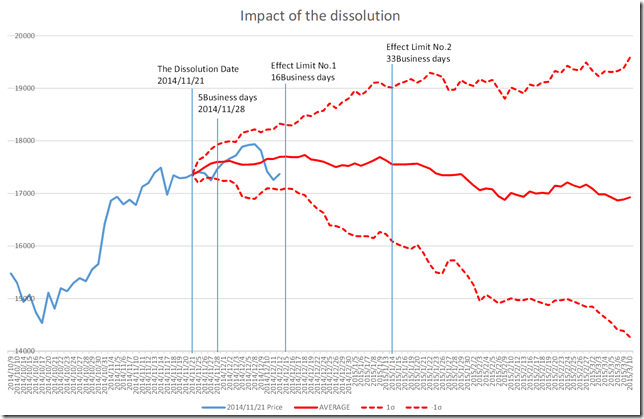
解散から15営業日経ちました。

2014/11/30に報告した過去の解散データと照らし合わせると下落から下降傾向は正しいかったようです。

It takes 15 business days from the dissolution of the House of Representatives.

We refer to the past data and “steadiness or falling tendency” is right. (See 11/30/2014 report)

CHART1


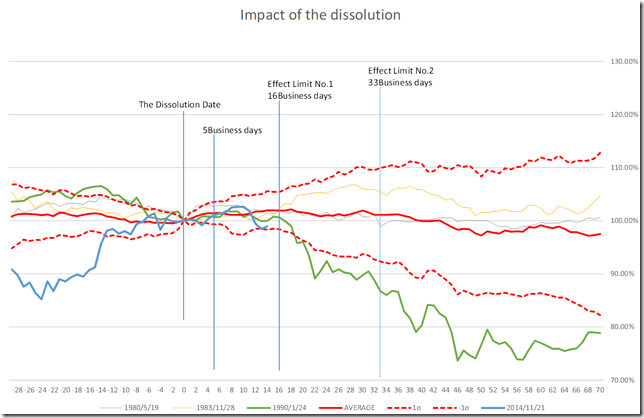
データ数がそれなりに揃いましたので過去の相場とよく似た相場を調査しました。

過去のデータと現在のRetar INDEXデータを比較すると現在の相場と高い相関関係を持っているのは1990/1/24の解散です。

We can gather enough data and comparing similar market.

The best similar market is 1/24/1990 dissolution.

CHART2


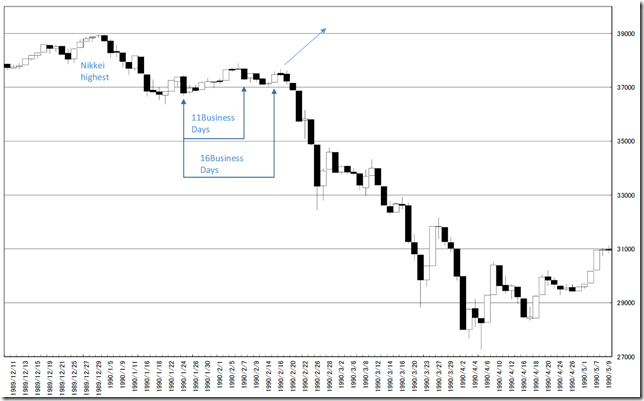
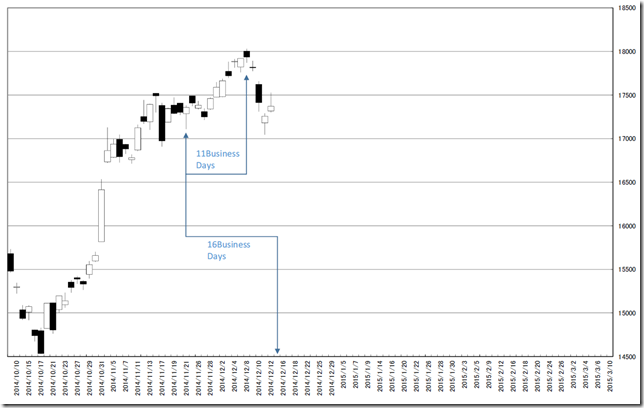
日柄も似てきており、解散後の10-11営業日で高値をつけています。

同じような値動きを辿るのであれば、来週はどこかで戻り高値をつけてもおかしくありません。

2014/11/09のレポートでは、「日経平均日足・金融緩和の影響を比較・現在に当てはめると初押しは買い、2014/12/15-17に利食い」としています。

強烈な日柄が集中しているので要注意です。

The latest “HIGARA” is similar to 1990’s and it took the highest 10 to 11 business days from the dissolution of the House of Representatives.

If the latest market will follow the 1990’s price movement, the market price will take recovery high in next week.

We reported “NIKKEI 225 daily; Comparing to past Monetary Easing; Apply to the latest market, buy in dip and take profit from 12/15/2014 to 12/17/2014”. In 11/09/2014.

Strong “HIGARA” are concentrated; we need to watch the market.

1990

now


相場分析のリクエストがありましたら“Contact Us”からお知らせください。ご要望にお応えできるように努力いたします。

このブログはあくまでも個人的な見解であり、投資判断は各自でお願い致します。当ブログは一切の投資損益に対する責任を負いません。

ホームページに来て下さってありがとうございます。明日もよろしくお願いいたします。

If you have some request to analyze, please write to “Contact Us”.

We do best effort for your request.

These are only personal opinions on this blog, and you need the investment judgment in each one. This blog doesn’t assume the responsibility to all the investment profit and loss.

Thank for watching our contents. My best regards next day.

如果您需要行情分析,请点击“Contact Us”联系我们。我们将尽力满足您的要求。

本博客仅为个人意见,请各自做出投资判断。本博客概不对任何投资盈亏负责。

感谢您访问本博客。欢迎再次使用。


ドル円超長期足P&F月足。想定される今後のシナリオはワイルドでボラタイルかも/Very long term USDJPY P&F monthly view; the market may be wild and volatile in future. /美元/日元月K。P&F分析。市场的未来可能会变动变得大。

2014/12/11

ドル円超長期足P&F月足。想定される今後のシナリオはワイルドでボラタイルかも

Very long term USDJPY P&F monthly view; the market may be wild and volatile in future.

美元/日元 月K。P&F分析。市场的未来可能会变动变得大。


本日は長期ドル円についてです。

1枠5円、3枠転換の終値ポイントアンドフィギュアです。

1960年代以降の月末クローズで書いています。

Today’s analyze is long term Dollar/Yen rate.

This is 5 price change and 3 box reversal close price’s Point and Figure chart.

We use closure price the end of the month after 1960’s.


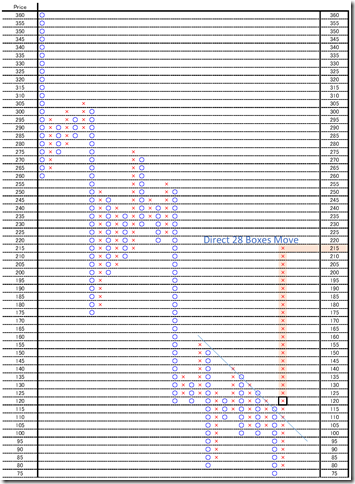
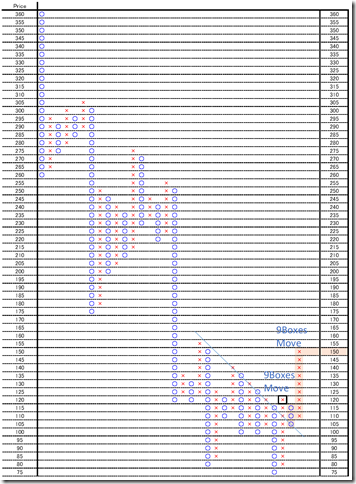
昨日のレポートでは、「ドル円超長期足P&F月足。215円前後の上昇視野」としていますが、実際にどのようなシナリオが想定されるか考えてみました。

月足なので、数か月から数年以内に起こりうるシナリオです。

2014/11に45度線を超えた事実を重く受け止める必要があるとみています。

今月末に120円台前半になるとして、今後想定されるチャートを考えてみました。

(想定部分の背景色を赤くしています)

Last day, we reported “Very long term USDJPY P&F monthly view; now may be the break to 215 yen around” and today, we analyze what kind of scenarios will come in future.

This is monthly data and the scenario will occur within from several months to several years.

The best notable point is cutting 45 degree resistance line in11/2014.

We estimate the market price will close 120yen low in this month and estimate the future chart.

(The background color in an assumption part is made red.)


1. いきなり215円に向かう/Going up to 215yen around

想定されるシナリオとしては、一番過激なパターンです。

しかし、過去の下落幅からすると驚くには値しないブレークです。(2014/12/10レポート参照)

This is the best drastic estimate.

But this is not suppressing break. (See 12/10/2014 report)

1


2. 105円付近まで下落してから再上昇/Price will drop to 105yen around and jump again

一旦105円付近まで下落したのち再上昇を開始するパターンです。

比較的マイルドな上昇となり、150円を超えていくことになると思います。

150円を超えてから加速していくようなイメージです。

The market price fall 105yen around first and re-jump.

This is relatively mild jump and will go over 150yen.

Cutting 150 yen and will accelerate jumping.

2


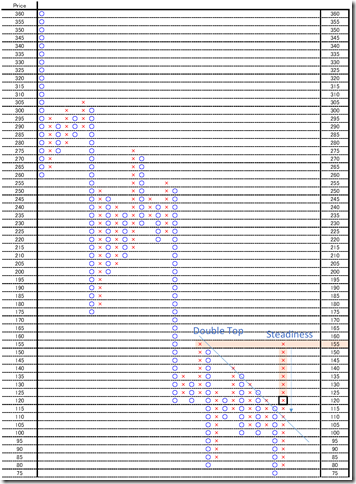
3. いきなり150円でダブルトップ後持ち合い/the price will reach 150yen around directly and will become steadiness

一番考えられないシナリオです。

45度線を超えた事実を軽んじすぎです。

やはり、150円を超えていくシナリオを考えていくべきだと思います。

This will not come true.

This estimate make light of cutting 45 degree resistance line.

We should choose 150 yen over scenario first.

3


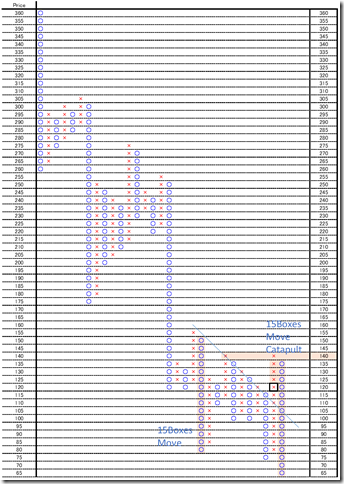
4. 140円まで上昇してカタパルトで65円まで下落/the market price will jump to 140 yen around and will fall 65yen around.

意外とありそうなパターンです。

過激なパターンですが、相場というのはこういうものです。

心の片隅に、このようなパターンも考慮する必要があると思います。

This is the probable pattern.

This is very drastic but this pattern often come true.

We should prepare this strong yen pattern in our mind.

4


相場分析のリクエストがありましたら“Contact Us”からお知らせください。ご要望にお応えできるように努力いたします。

このブログはあくまでも個人的な見解であり、投資判断は各自でお願い致します。当ブログは一切の投資損益に対する責任を負いません。

ホームページに来て下さってありがとうございます。明日もよろしくお願いいたします。

If you have some request to analyze, please write to “Contact Us”.

We do best effort for your request.

These are only personal opinions on this blog, and you need the investment judgment in each one. This blog doesn’t assume the responsibility to all the investment profit and loss.

Thank for watching our contents. My best regards next day.

如果您需要行情分析,请点击“Contact Us”联系我们。我们将尽力满足您的要求。

本博客仅为个人意见,请各自做出投资判断。本博客概不对任何投资盈亏负责。

感谢您访问本博客。欢迎再次使用。

© 2025 Retar