2014/12

ドル円超長期足P&F月足。215円前後の上昇視野/Very long term USDJPY P&F monthly view; now may be the break to 215 yen around. /美元/日元 月K。P&F分析。大于约215日元可能性就出来了。

2014/12/10

ドル円超長期足P&F月足。215円前後の上昇視野

Very long term USDJPY P&F monthly view; now may be the break to 215 yen around.

美元/日元 月K。P&F分析。大于约215日元可能性就出来了。


本日は長期ドル円についてです。

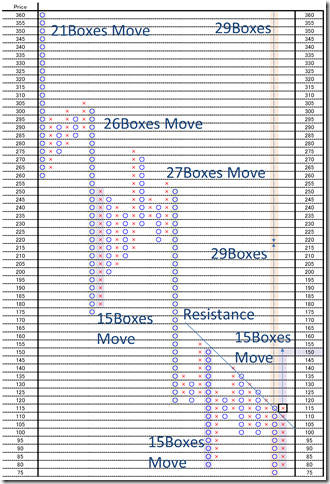
1枠5円、3枠転換の終値ポイントアンドフィギュアです。

1960年代以降の月末クローズで書いています。

Today’s analyze is long term Dollar/Yen rate.

This is 5 price change and 3 box reversal close price’s Point and Figure chart.

We use closure price the end of the month after 1960’s.


長い間抑え込まれていた45度線を2014/11に超えました。

ブル相場が開始されたシグナルになります。

上値目途は現在までの最大の上昇値幅と同じ15枠移動を仮定すると、150円が最初の目標だと考えられます。

The market price cut 45 degree strong resistance in 2014/11.

This means the start of the bull market.

The first upper side limit will be 150yen around; 15 boxes vertical move.


しかし、この相場は360円からの一方的な下落相場です。

本格的な反転であるなら半値試しとなるはずです。

半値は29枠移動、215円近傍となります。

もし、一方向に215円を目指すとするなら底からの28枠移動となります。

28枠の一方向の下落は、過去に経験したことなので、それほど不自然なことではありません。

28枠の一方的な上昇があってもチャート的に驚きがありません。

But this is the one side direction falling market from 360yen.

If this bull market will be the true recovery, the market price is targeting the half price.

The half price is 29 boxes move and this is 215 yen around.

If it will be one side direction to reach 215yen, this will be 28boxes move.

There were 28 boxes fall in past market; this is only natural moving!

If it will be 28 boxes direct move, this is very natural jump on the chart.


ファンダメンタルしか考慮しない方に215円という数字を言うと笑われます。

しかし、P&Fはファンダメンタル以上に真実を突きつけることがあるのでご注意を。

仮定や前提の何かが根本的に変化していると考える状況かもしれません。

If you may only believe fundamental condition, you may laugh 215 yen.

But P&F only suggests the truth of the market; it exceed the fundamental condition.

We need to doubt the fundamental condition or common sense may change.

PF


相場分析のリクエストがありましたら“Contact Us”からお知らせください。ご要望にお応えできるように努力いたします。

このブログはあくまでも個人的な見解であり、投資判断は各自でお願い致します。当ブログは一切の投資損益に対する責任を負いません。

ホームページに来て下さってありがとうございます。明日もよろしくお願いいたします。

If you have some request to analyze, please write to “Contact Us”.

We do best effort for your request.

These are only personal opinions on this blog, and you need the investment judgment in each one. This blog doesn’t assume the responsibility to all the investment profit and loss.

Thank for watching our contents. My best regards next day.

如果您需要行情分析,请点击“Contact Us”联系我们。我们将尽力满足您的要求。

本博客仅为个人意见,请各自做出投资判断。本博客概不对任何投资盈亏负责。

感谢您访问本博客。欢迎再次使用。


NY金週足・2015年3月末からの動きが本物臭い/NY GOLD weekly; the true trend will appear at the end of March, 2015. /纽约黄金。周K。在2015年3月底真正的动开始。

2014/12/09

NY金週足・2015年3月末からの動きが本物臭い

NY GOLD weekly; the true trend will appear at the end of March, 2015.

纽约黄金。周K。在2015年3月底真正的动开始。


本日はNY金週足を分析します。

Today we analyze NY gold weekly.


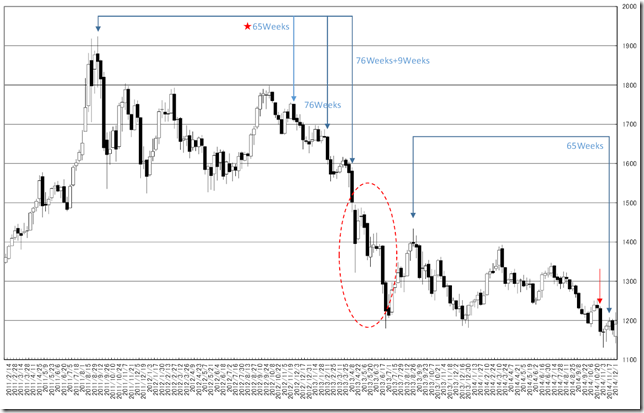
NYゴールドの相場で最も気になっていたことは、なぜ赤矢印の地点で赤点線丸のように大きく崩れていかなかったかと言う点です。

理由が日柄不足ということであれば、説明がつきます。

The best notable point on the chart is “Why did not felled at red arrow point such as red circle?”

If the reason is the shortage of “HIGARA”, we can explain.


現在の相場のモジモジというのは、2011/9に高値をつけた相場が新高値をつけず、モジモジしていたことを思い起こさせます。

この相場がレンジを切り替え出したのは76週+9週から。

この現象が現在の相場に発生しているとすると、起点は戻り高値の2013/08/26の週となり、先週末まで67週。

直近では新安値をつけていても、なお持ち合いの相場が継続していると仮定できます。

赤矢印の地点では日柄不足となり、動きが出なくて当然です。

The latest market is similar to the steadiness after taking the highest in 09/2011.

The change occurred 76 + 9 weeks after taking the highest.

If now is similar occasion, the start of “HIGARA” counting is 08/26/2013 week and it takes 67 weeks from at that week.

The latest market took new low but this may be in the reach of the steadiness.

And it was too short to make a big move at red arrow point.

CHART1


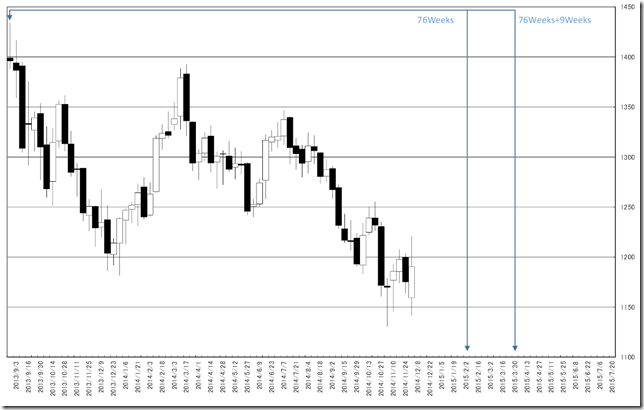
現在の相場が、高値からの76週を迎えるのは2015/2/2の週。

2014/12/08のレポートで報告した「伸びるようだと、2015/1/25の週(2014/6/16からの33週)、2015/2/2,2015/2/9の週(2014/2/17からの51.52週)にかけて新高値を試すシナリオを考えたいと思います。」とも符合します。

また、76週+9週からが本物臭い動きとなるならば、2015/03/30の週から目の覚める動きが出てくる可能性が高まります。

The latest market reach 76 week in 2/2/2015 week.

We reported “If the market price will jump, our scenario are these; the market price will challenge new high in 1/25/2015 week (33 weeks from 6/16/2014 week) or in 2/2/2015 or 2/9/2015 week (51 and 52 weeks from 2/17/2014 week)” in 12/08/2014.

And if the true trend will appear in 76 +9 weeks, the awaking week will be 03/30/2015 week.

CHART2


相場分析のリクエストがありましたら“Contact Us”からお知らせください。ご要望にお応えできるように努力いたします。

このブログはあくまでも個人的な見解であり、投資判断は各自でお願い致します。当ブログは一切の投資損益に対する責任を負いません。

ホームページに来て下さってありがとうございます。明日もよろしくお願いいたします。

If you have some request to analyze, please write to “Contact Us”.

We do best effort for your request.

These are only personal opinions on this blog, and you need the investment judgment in each one. This blog doesn’t assume the responsibility to all the investment profit and loss.

Thank for watching our contents. My best regards next day.

如果您需要行情分析,请点击“Contact Us”联系我们。我们将尽力满足您的要求。

本博客仅为个人意见,请各自做出投资判断。本博客概不对任何投资盈亏负责。

感谢您访问本博客。欢迎再次使用。

© 2025 Retar