米ダウ工業株日足P&F・2007年ピークアウトと現在の相場の共通点・大天井をつけている可能性あり
Dow Jones Industrial Average (^DJI) P&F Daily; the similarity of 2007’s market and the latest market; this market seems to have already peaked out.
美国道琼斯工业平均指数。P&F分析。2007年的市场和最新的市场相似性。市场已经达到顶峰。
本日は米ダウ工業株日足についてです。
結論は型的にベアマーケット入りを示唆しています。
本日は2007年マーケットと現在のマーケットのピークアウトを比較しました。
Today’s analyze is Dow Jones Industrial Average (^DJI) Daily.
Our conclusion is this market seems to have already getting into bearish market.
Today, we compared 2007’s market and the latest market.
1枠50point、3枠転換の終値ポイントアンドフィギュアです。
現在の相場と2007年相場の似た様子を発見したので報告します。
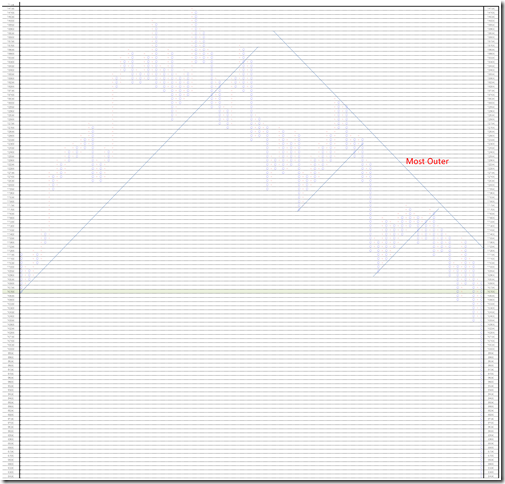
2007年の相場では、ピークアウトしたときに、45度線の開始地点までの全値戻し(10700ポイント)が発生して、ベアマーケットになりました。
また、下落中には最外郭線を超えることなく落ちて行っていることも確認できます。
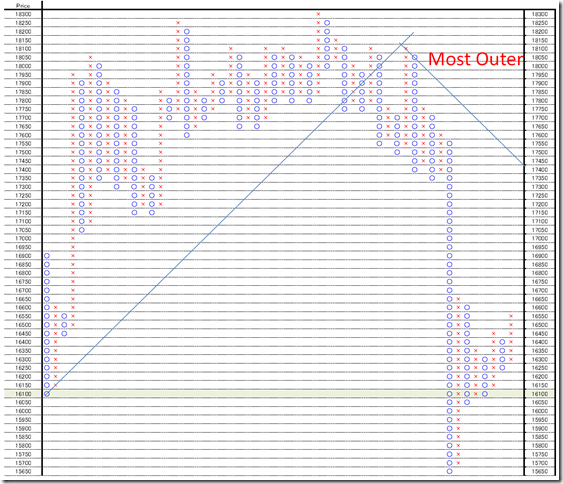
現在の相場も、全値戻し(16100ポイント)までの下落しているため、2008年の底以来初の全値戻しを経験しています。
また、下落中に最外郭の45度線を超えていないため、2007年相場とよく似た状況に見えます。
This is 50point change and 3 box reversal close price’s Point and Figure chart.
We find out some similarity of 2007’s market and the latest.
When the market price peaked out in 2007’s market, the market price pulled back the 45 degree starting point (10700point) and became bearish market.
And the market price did not cut the 45 degree resistance line until then.
The latest market felled 16100 point over and this was the first time the price pulled back the 45 degree support point since 2008.
And the price did not cut 45 degree resistance line; this is very similar to 2007’s market.
<2007>
< 2015>
相場分析のリクエストがありましたら“Contact Us”からお知らせください。ご要望にお応えできるように努力いたします。
このブログはあくまでも個人的な見解であり、投資判断は各自でお願い致します。当ブログは一切の投資損益に対する責任を負いません。
ホームページに来て下さってありがとうございます。明日もよろしくお願いいたします。
If you have some request to analyze, please write to “Contact Us”.
We do best effort for your request.
These are only personal opinions on this blog, and you need the investment judgment in each one. This blog doesn’t assume the responsibility to all the investment profit and loss.
Thank for watching our contents. My best regards next day.
如果您需要行情分析,请点击“Contact Us”联系我们。我们将尽力满足您的要求。
本博客仅为个人意见,请各自做出投资判断。本博客概不对任何投资盈亏负责。
感谢您访问本博客。欢迎再次使用。


