2016/06

NY Gold 月足・現在の値動きは1972年や2006年に近い・答えは秋から冬に示現か/NY Gold Monthly; the latest price movement is similar to 1972 and 2006 and we can know the trend from Autumn to Winter. /纽约黄金。最新的价格变动是类似于1972年和2006年。从秋季到冬季,我们可以知道趋势。

2016/06/09

NY Gold 月足・現在の値動きは1972年や2006年に近い・答えは秋から冬に示現か

NY Gold Monthly; the latest price movement is similar to 1972 and 2006 and we can know the trend from Autumn to Winter.

纽约黄金。最新的价格变动是类似于1972年和2006年。从秋季到冬季,我们可以知道趋势。


本日はNY Gold長期の分析です。

結論は、2016/06/08のレポートでは「要は「なんでもかんでも売っちゃえの」セリングクライマックス待ち。」と報告していますが、期待薄かもしれません。

もしかすると1200ポイントを少し下回った地点が鉄板底の可能性を秘めています。

Today, we analyze NY Gold long term.

We reported “Our conclusion is In short, we are only waiting for ‘Selling climax’ “ in 06/08/2016 but the may not come true.

1100 point high may be “The Iron plated bottom”.


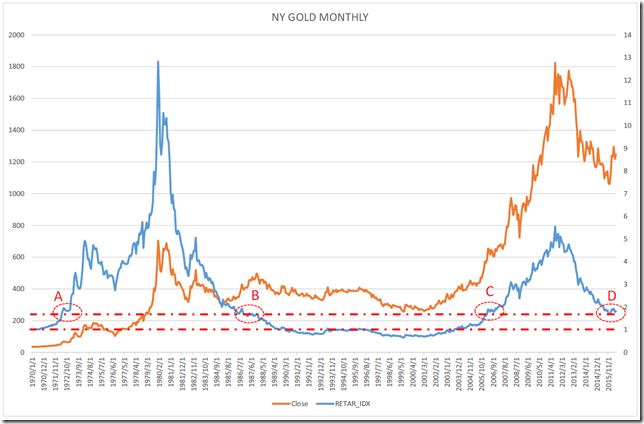
1970年代以降のNYGOLDの月足です。

本日はRetarオリジナルの指標Retar Indexを使用し分析しています。

Retar Indexでは水準感を定量化するためには適しています。

現在の水準は1972年(A地点)、1986年(B地点)、2006年(C地点)と同程度の水準感で下げ止まっています。

興味深いのはこの水準が、サポートにもレジスタンスとしても働いてきた歴史です。

This is the monthly chart after 1970.

We use our original method, “Retar Index” and analyze.

This method is effective comparing to the price level.

The latest level is close to 1972 (A point), 1986 (B point) and 2006 (C point).

In past market, this zone was worked as the support level.

chart1


拡大してみるとよくわかります。

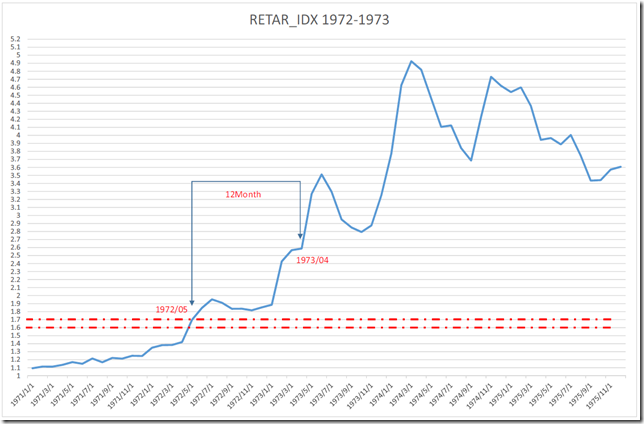
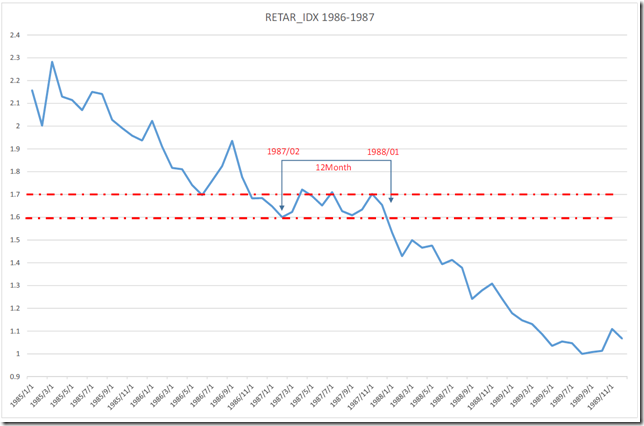
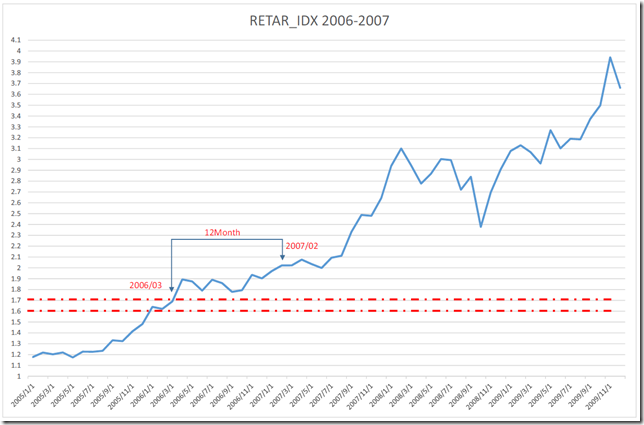
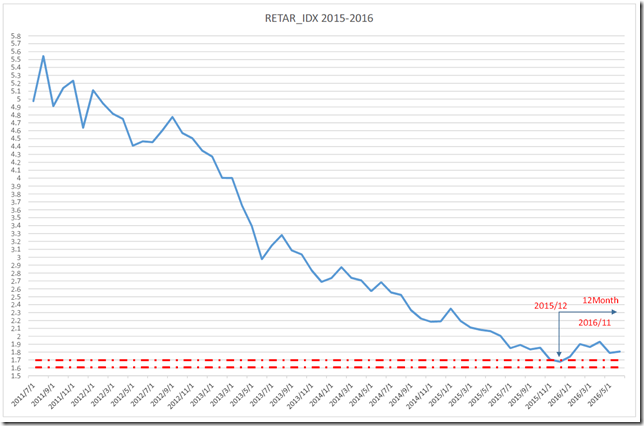
現在の型は1.6ポイントを下回ることなく、1.7ポイントをサポートにしているため、1972年や2006年の型に近いことがわかります。

また、1.6ポイントや1.7ポイント付近では約1年の持ち合いとなっています。

現在の相場は、1.7ポイントを上回っており、底を付けたのは2015/12であったため、2016/11が1年となります。

つまり、秋から冬にかけて、トレンドが出やすいとみえます。

この分析は、2016/05/19のレポート「NY Gold超長期・「右手にマツタケ、左手に延べ棒」・秋は金買い場か?」と同様の結論となります。

We can know by magnifying.

The latest market is close to 1972 and 2006 market because the market price could not cut 1.6 point and 1.7 point works as the support point.

And from 1.6 point to 1.7 point around, the indicator stayed around there.

The latest market is over 1.7 point and the indicator took the lowest in 12/2015; taking one year is 11/2016 around.

So that a major trend will appear from autumn to winter.

This conclusion is similar to “NY Gold Long term; autumn will be a good opportunity to buy” (Reported in 05/19/2016).

chart2

chart3

chart4

chart5


相場分析のリクエストがありましたら“Contact Us”からお知らせください。ご要望にお応えできるように努力いたします。

このブログはあくまでも個人的な見解であり、投資判断は各自でお願い致します。当ブログは一切の投資損益に対する責任を負いません。

ホームページに来て下さってありがとうございます。明日もよろしくお願いいたします。

If you have some request to analyze, please write to “Contact Us”.

We do best effort for your request.

These are only personal opinions on this blog, and you need the investment judgment in each one. This blog doesn’t assume the responsibility to all the investment profit and loss.

Thank for watching our contents. My best regards next day.

如果您需要行情分析,请点击“Contact Us”联系我们。我们将尽力满足您的要求。

本博客仅为个人意见,请各自做出投资判断。本博客概不对任何投资盈亏负责。

感谢您访问本博客。欢迎再次使用。


NY Gold 週足・トレンドライン・順張りなら1450ポイント以上からの買い/NY Gold Weekly; Trend line; following the trend, we will buy 1450point over. /纽约黄金。趋势线分析。如果跟随趋势,我们买1450点。

2016/06/08

NY Gold 週足・トレンドライン・順張りなら1450ポイント以上からの買い

NY Gold Weekly; Trend line; following the trend, we will buy 1450point over.

/纽约黄金。趋势线分析。如果跟随趋势,我们买1450点。


本日はNY Gold長期の分析です。

結論は現在の相場は「下がったら買え、順張りなら1450ポイント超えから」。

要は「なんでもかんでも売っちゃえの」セリングクライマックス待ち。

Today, we analyze NY Gold long term.

Our conclusion is “Buy on dip and following and 1450 point over will be trend following”.

In short, we are only waiting for “Selling climax”.


反省会です。

2016/02/24のレポートでは以下のように紹介しています。

チャート分析で大切なことは、「なにがどうなったら、どうする」を決めておくことです。

2016/01/02のレポートでは「1250ポイントを超えてくると上げの芽が出てきます」と書いています。

これが変化すれば、考え方をゼロベースで組み立てる必要性に迫られます。

Reviewing our report.

We introduced under these in 02/24/2016.

Analyzing technical chart, we need to define “What will it occur and what will do”.

We reported “On the other hand, channel breaking is 1250 point and this will be trend changing” in 01/02/2016.

Changing this condition, we need to rebuild our view with zero-base thinking.


環境が変化しているため、以下のようなレポートを紹介しています。

「NY金日足P&F・買いから入りたい。しかし下がってから」(2016/04/12レポート)

「NY Gold超長期・「右手にマツタケ、左手に延べ棒」・秋は金買い場か?」(2016/05/19レポート)

「NY Gold; 2016/5/5にジムロジャース氏は「金の調整は終わっていない」と報告しています;私たちも1150ポイント前後まで待った方がいいとみています」(2016/06/01レポート)

つまるところ、鉄板底臭い相場とみています。

This market condition was changed and we introduced under these.

“NY GOLD Daily P&F; Bullish but waiting for a dip.”(See 04/12/2016 report)

“NY Gold Long term; Autumn will be a good opportunity to buy. ” (See 05/19/2016 report)

“NY Gold; Mr. Jim Rogers says “Gold: This Is Not The End Of The Correction” in 5/5/2016; And we also think we should wait for 1150point.” (See 06/01/2016 report)

After all, our conclusion is now is “Iron plated bottom”.


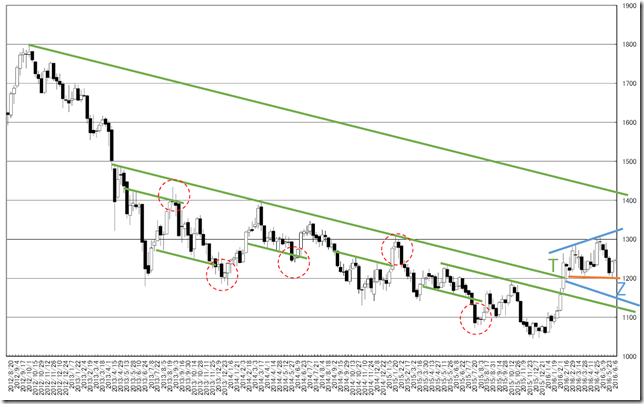
週足の分析です。

いままで何故トレンドラインのレポートが書けなかったのか?

問題はT地点(緑系列)です。

「さあ、あがるぞー」といった地点から、上がってこなかったのは事実です。

つまり、緑系列のトレンドラインの意味とは、超えたとしても赤丸地点のようにまもなく反転を迎えることを示唆しているのです。

もし、これが本物のトレンド転換となるなら、少なくとも別のトレンドラインが存在していると考えて良いとみています。

少なくとも角度は緑よりも低角度であり、1450pointを超えてからのトレンドとなるのが筋です。

また現在の相場は、Y波動であるため下値も上値もある相場になりそうです。

1150ポイントまでの振れは覚悟しておいた方が良さそうです。

This is weekly chart analysis.

Why we could not write about the trend line report?

The reason why we could not write is we could not judge the proper meaning of “T” point (Green line series).

This is often the start of bull trend but this market did not became so.

After all, the meaning of the green line series is “mini breaking” such as red circle.

If cutting the green line will be the true trend reversal, there is more other trend line.

At least, this line’s degree is lower degree and cutting 1450 point over will be the true trend.

And the latest market is “Y” wave; this often implies volatile market.

The lower side will be 1150 point around.

chart1


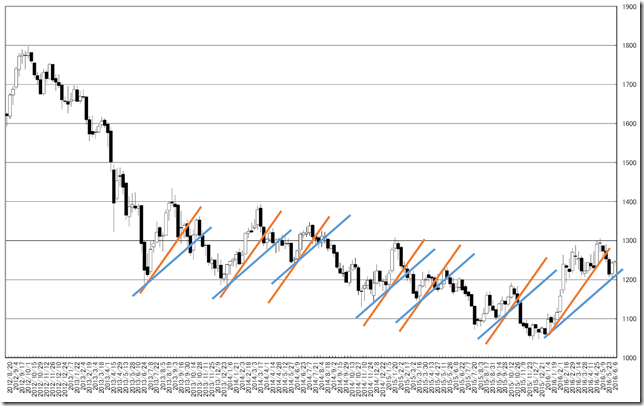
信頼がおけそうなトレンドラインはサポート側です。

オレンジを割ったため、青を割るのは時間の問題です。

オレンジと青の間は良い売り場を提供しており、青を割ると値段が崩れています。

The more reliable lines are support lines.

The price cut the orange line and cutting blue line became natural.

Between orange and blue provided well selling opportunity and cutting blue line became bearish.

chart2


相場分析のリクエストがありましたら“Contact Us”からお知らせください。ご要望にお応えできるように努力いたします。

このブログはあくまでも個人的な見解であり、投資判断は各自でお願い致します。当ブログは一切の投資損益に対する責任を負いません。

ホームページに来て下さってありがとうございます。明日もよろしくお願いいたします。

If you have some request to analyze, please write to “Contact Us”.

We do best effort for your request.

These are only personal opinions on this blog, and you need the investment judgment in each one. This blog doesn’t assume the responsibility to all the investment profit and loss.

Thank for watching our contents. My best regards next day.

如果您需要行情分析,请点击“Contact Us”联系我们。我们将尽力满足您的要求。

本博客仅为个人意见,请各自做出投资判断。本博客概不对任何投资盈亏负责。

感谢您访问本博客。欢迎再次使用。

© 2025 Retar