2017/04

ドル円1時間足・レンジ相場は続く・ブレークは112円台乗せ、110円台割れ/USDJPY hourly; Range market is still going on; breaking will go up 112yen over or will cut 110yen. /美元/日元。范围市场仍在继续。要是范围市场要退出,就112日元上面或吗110日元下面。

2017/04/10

ドル円1時間足・レンジ相場は続く・ブレークは112円台乗せ、110円台割れ

USDJPY hourly; Range market is still going on; breaking will go up 112yen over or will cut 110yen.

美元/日元。范围市场仍在继续。要是范围市场要退出,就112日元上面或吗110日元下面。


本日はドル円についてです。

Today, we analyze USDJPY.


「ドル円週足・中長期トレンドライン・売りシグナル点灯、ターゲット103-105円だが、素直に下げていくとも思えず」(2017/3/22)

と言うわけで、中長期でやりたいことは戻り売りです。

とはいっても、「ドル円週足・中長期P&F・110円以下の突っ込みだけなら一旦の買い場か」(2017/4/2)の想定があり、この局面もおいしそうです。

一度は110円以下の何処かで買いを入れたいと思います。

We reported “USDJPY Weekly; Trend line; Selling opportunity and the target price is 103-105yen around but this will not obedient fall” in 3/22/2017.

We only want to do is “Sell at recovery high” in mid-to-long term view.

But we reported “USDJPY Weekly P&F; only sharply falling in lower than 110yen, it seems to be buying opportunity” (4/2/2017) and this will be a great opportunity.

Only once, we want to buy lower than 110yen.


1時間足を使用しオセアニア時間帯を省いています。

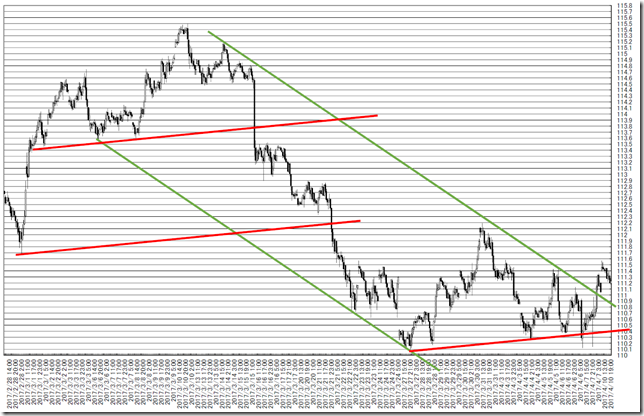
2017/4/6に引いたトレンドラインは、下方向にも上方向にも切れているため、レンジマーケットの可能性が高まります。

We used hourly data and the Oceania time zone market price is pulled out.

Green and Red lines reported in 4/6/2017 was cut and this often suggests “Range market”.

chart1


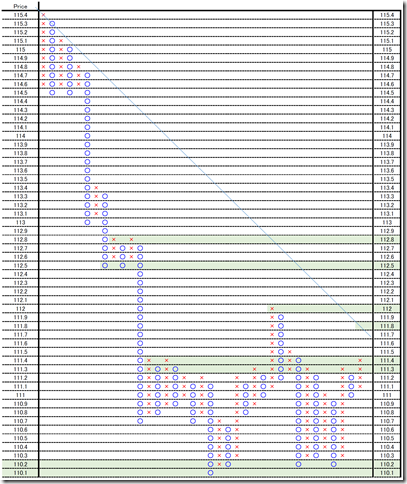
1枠0.1円、3枠転換の終値ポイントアンドフィギュアです。

1時間足を使用しオセアニア時間帯を省いています。

引き続きブレーク待ちです。

112円超えから買い、110円割れから売りで攻めていきたい局面です。

This is 0.1 price change and 3 box reversal close price’s Point and Figure chart.

We used hourly data and the Oceania time zone market price is pulled out.

We still need to waiting for a breaking.

Cutting 112yen over or going lower than 110yen will be an opportunity.

PF


相場分析のリクエストがありましたら“Contact Us”からお知らせください。ご要望にお応えできるように努力いたします。

このブログはあくまでも個人的な見解であり、投資判断は各自でお願い致します。当ブログは一切の投資損益に対する責任を負いません。

ホームページに来て下さってありがとうございます。明日もよろしくお願いいたします。

If you have some request to analyze, please write to “Contact Us”.

We do best effort for your request.

These are only personal opinions on this blog, and you need the investment judgment in each one. This blog doesn’t assume the responsibility to all the investment profit and loss.

Thank for watching our contents. My best regards next day.

如果您需要行情分析,请点击“Contact Us”联系我们。我们将尽力满足您的要求。

本博客仅为个人意见,请各自做出投资判断。本博客概不对任何投资盈亏负责。

感谢您访问本博客。欢迎再次使用。


NY金中長期トレンドライン・2002年に倣うなら昇竜のようなトレンドは1360ポイント超えから/NY GOLD mid-to-long term; Following 2002 market, a great rally will start cutting 1360 point with candle stick body. /纽约黄金。趋势线分析。2002年的一样的话,如果纽约黄金的价为1350点超过,就上涨。

2017/04/08

NY金中長期トレンドライン・2002年に倣うなら昇竜のようなトレンドは1360ポイント超えから

NY GOLD mid-to-long term; Following 2002 market, a great rally will start cutting 1360 point with candle stick body.

纽约黄金。趋势线分析。2002年的一样的话,如果纽约黄金的价为1350点超过,就上涨。


本日はNY Goldについてです。

Today is about NY Gold.


「既に景色が変わっているとみています。」(2017/1/31レポート)

「息の長い相場は始まっているとみているため、押しは買い向かいたいと思います。」(2017/2/27報告)

We reported “We think this market trend seems to have already changed” in 1/31/2017.

And we also reported “We are bullish and dip will be a great opportunity” in 2/27/2017.


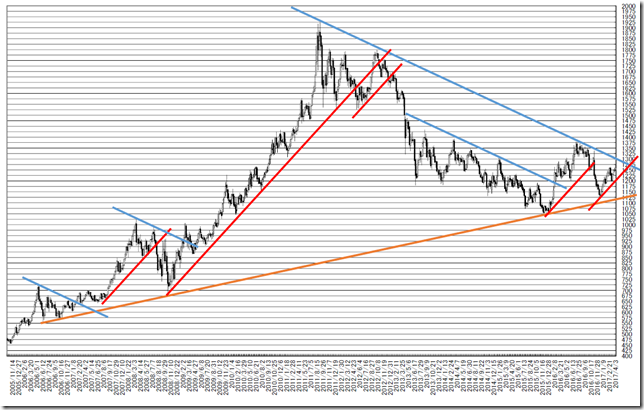
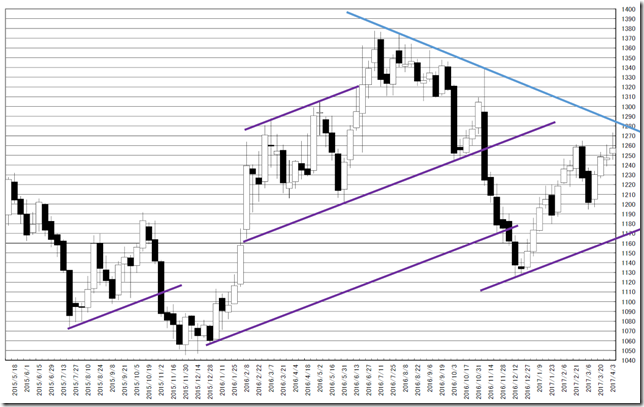
トレンドラインでは最外郭に再び到達しようとしています。

なお、1280ポイントぐらいまので上値余地をのこしているとみています。

This market seems to reach the most outer line.

Rally seems to continue more and the resistance is 1280 point around.

CHART1

chart2


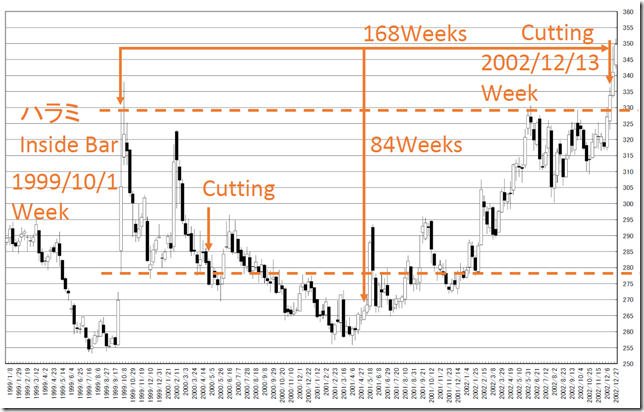
本日は2002年相場と現在の相場の類似点を調査しました。

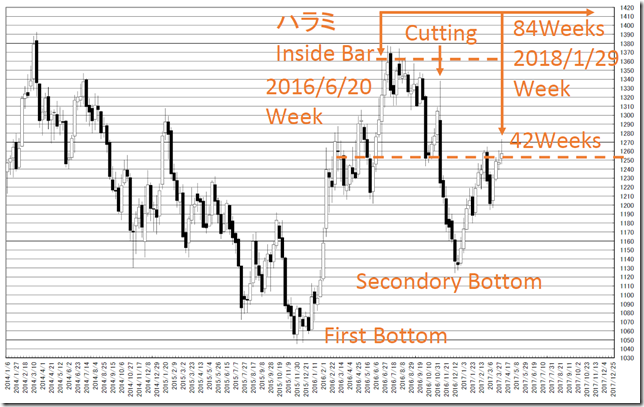
興味深いのはハラミからの抜けです。

2002年のマーケットでは、高値圏に現れたハラミ線からの実体抜きから息の長い相場が示現しました。

ハラミから抜けまで168手でした。

また、高値圏に現れたハラミ線の後に2番底をつけており、安値の示現は半分より前でした。

現在の状況もよく似ており、高値圏に現れたハラミの「実体抜き」ができない状態です。

日柄的には42手(84手の半分、みんな大好きな数字)の前に2番底らしきものをつけており、倍速で進んでいる可能性を秘めます。

もし、倍速相場が再現されるのであれば、84手は2018/1/29の週となります。

いずれにせよ、相場が2番底を切らない限り、注目したいと思います。

We survived the similarity between 2002 market and the latest market.

The most notable point is “Cutting Inside Day Bar”.

In 2002 market, the “Inside Day” appeared in higher zone and the big rally started cutting it.

From the “Inside Day” to the cutting point, it was 168 weeks.

And the secondary bottom appeared after the “Inside Day”.

And it was before the half time (84 weeks).

The latest condition is similar and the price cannot cut the “Inside Day Bar”.

The price took the secondary bottom (It seems to be so??) before 42 weeks (42 weeks is the half of 84 weeks) and the latest “HIGARA” speed may be double.

If the latest market will be the “Double Speed”, 84weeks will be 1/29/2018 week,

In any way, the price will not cut the secondary bottom, we need to watch this occasion.

chart3

chart4


相場分析のリクエストがありましたら“Contact Us”からお知らせください。ご要望にお応えできるように努力いたします。

このブログはあくまでも個人的な見解であり、投資判断は各自でお願い致します。当ブログは一切の投資損益に対する責任を負いません。

ホームページに来て下さってありがとうございます。明日もよろしくお願いいたします。

If you have some request to analyze, please write to “Contact Us”.

We do best effort for your request.

These are only personal opinions on this blog, and you need the investment judgment in each one. This blog doesn’t assume the responsibility to all the investment profit and loss.

Thank for watching our contents. My best regards next day.

如果您需要行情分析,请点击“Contact Us”联系我们。我们将尽力满足您的要求。

本博客仅为个人意见,请各自做出投资判断。本博客概不对任何投资盈亏负责。

感谢您访问本博客。欢迎再次使用。

© 2025 Retar