2017/04

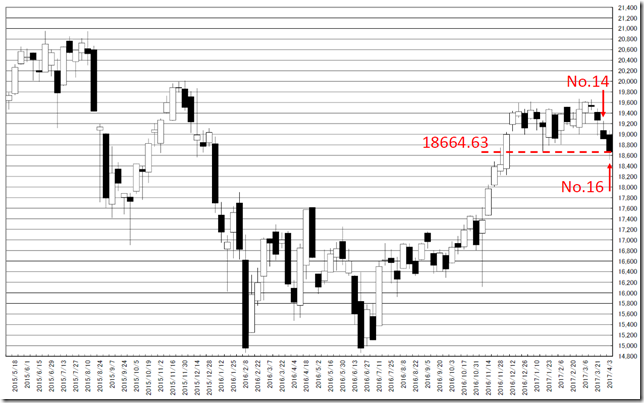
日経平均週足・羽黒16(10)号線・2008/6/23の週に似る・過去に倣うならレジスタンスは18664.63円/NIKKEI 225 weekly is “HAGURO” No.16(10) formation; Now is similar to the week of 6/23/2008; following the past price movement, 18664.63yen will work as resistance. /日经225。羽黑16(10)号线。现在的情况和2008年6月23号的周是类似的。18664.63日元将作为阻力。

2017/04/07

日経平均週足・羽黒16(10)号線・2008/6/23の週に似る・過去に倣うならレジスタンスは18664.63円

NIKKEI 225 weekly is “HAGURO” No.16(10) formation; Now is similar to the week of 6/23/2008; following the past price movement, 18664.63yen will work as resistance.

日经225。羽黑16(10)号线。现在的情况和2008年6月23号的周是类似的。18664.63日元将作为阻力。


本日は日経225についてです。

結論は、基本的には底堅いとみていますが、2008/6/28の週とのデジャブ感が不気味です。

Today is about N225.

Our conclusion is lower side will be stable but now may be déjà vu of 6/23/2008 week.


「日経平均週足・羽黒4号線・2008/5/26の週との不気味な共通点」(2017/2/10レポート)と報告しています。

2017/3/31に「日経平均週足・羽黒14(15)号線・普通なら底堅い、しかし2008/6/16の週とも似ている」と報告しています。

We reported “NIKKEI 225 weekly is “HAGURO” No.4 formation; Now seem to be Déjà vu of 5/26/2008 week” in 2/10/2017.

We reported “NIKKEI 225 weekly is “HAGURO” No.14(15) formation; in most case, this market will be stable but we can remind 6/16/2008 week” in 3/31/2017.


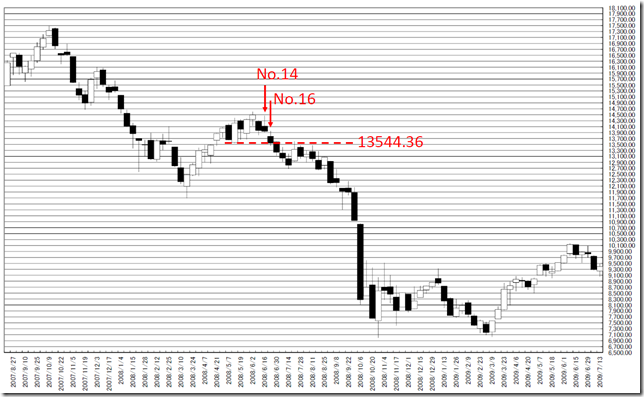
日経225週足線は羽黒16(10)号線となりました。

日経225週足線では200週で羽黒16(10)号線は37回出現しています。

頻出するため単体では判定不能です。

しかし、2008年相場と類似点として、14号線の後に16号線から下離れした点があげられます。

また、過去に倣うなら、今後の値動きとして注目したいのは今週の終値がレジスタンスになりそうな点です。

In this week, N225 formed “HAGURO” No. 16(10) formation.

In past 200 weeks, N225 price formed “HAGURO” No. 16(10) formation was 37 times.

This formation appears too often and we cannot judge the tendency by single formation.

But there is similarity between 2008 market and No.14 and No. 16 combination is very similar.

And following the past market, this week close price will work as resistance point.

chart1

chart2


相場分析のリクエストがありましたら“Contact Us”からお知らせください。ご要望にお応えできるように努力いたします。

このブログはあくまでも個人的な見解であり、投資判断は各自でお願い致します。当ブログは一切の投資損益に対する責任を負いません。

ホームページに来て下さってありがとうございます。明日もよろしくお願いいたします。

If you have some request to analyze, please write to “Contact Us”.

We do best effort for your request.

These are only personal opinions on this blog, and you need the investment judgment in each one. This blog doesn’t assume the responsibility to all the investment profit and loss.

Thank for watching our contents. My best regards next day.

如果您需要行情分析,请点击“Contact Us”联系我们。我们将尽力满足您的要求。

本博客仅为个人意见,请各自做出投资判断。本博客概不对任何投资盈亏负责。

感谢您访问本博客。欢迎再次使用。


ドル円1時間足・引き続き嵐の前の静けさ・ブレークは112円台乗せ、110円台割れ/USDJPY hourly; Now is still the calm before the storm; breaking will go up 112yen over or will cut 110yen. /美元/日元。仍然暴风雨前的平静。上边打破的是112日元超,还是110日元减。

2017/04/06

ドル円1時間足・引き続き嵐の前の静けさ・ブレークは112円台乗せ、110円台割れ

USDJPY hourly; Now is still the calm before the storm; breaking will go up 112yen over or will cut 110yen.

美元/日元。仍然暴风雨前的平静。上边打破的是112日元超,还是110日元减。


本日はドル円についてです。

Today, we analyze USDJPY.


ドル円週足・中長期トレンドライン・売りシグナル点灯、ターゲット103-105円だが、素直に下げていくとも思えず」(2017/3/22)

と言うわけで、中長期でやりたいことは戻り売りです。

とはいっても、「ドル円週足・中長期P&F・110円以下の突っ込みだけなら一旦の買い場か」(2017/4/2)の想定があり、この局面もおいしそうです。

一度は110円以下の何処かで買いを入れたいと思います。

We reported “USDJPY Weekly; Trend line; Selling opportunity and the target price is 103-105yen around but this will not obedient fall” in 3/22/2017.

We only want to do is “Sell at recovery high” in mid-to-long term view.

But we reported “USDJPY Weekly P&F; only sharply falling in lower than 110yen, it seems to be buying opportunity” (4/2/2017) and this will be a great opportunity.

Only once, we want to buy lower than 110yen.


1時間足を使用しオセアニア時間帯を省いています。

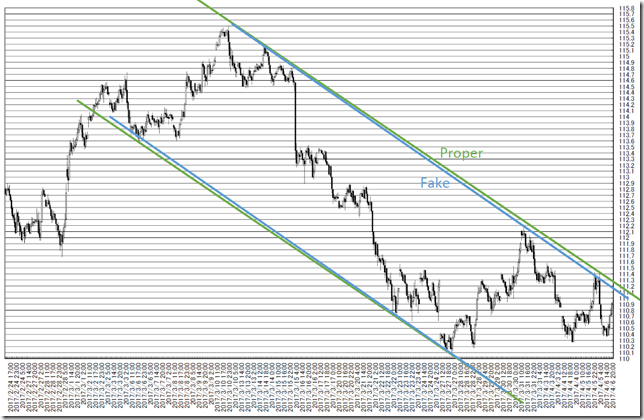
2017/4/3のトレンドラインの訂正です。

緑が正解だったようです。

We used hourly data and the Oceania time zone market price is pulled out.

We need to correct the trend lines in 4/3/2017.

Green lines are proper.

chart1


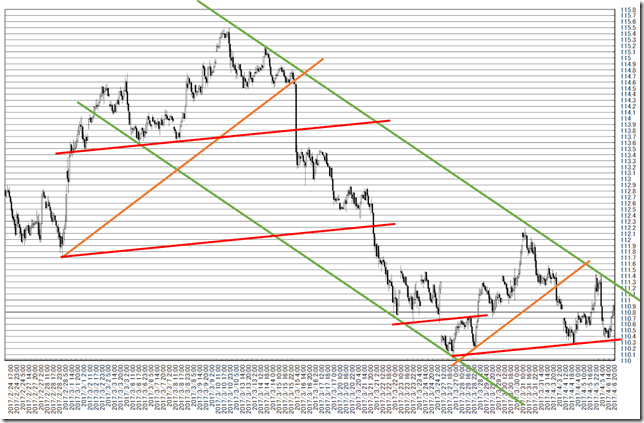
1時間足を使用しオセアニア時間帯を省いています。

今後は緑と赤がトレンドを決めるとみています。

どちらも大きな値動きを可能性があるとみています。

柔軟に対応したい局面です。

We used hourly data and the Oceania time zone market price is pulled out.

In future, cutting red or green lines will define the next trend.

This will be a big price movement.

We should be preparing for it.

chart2


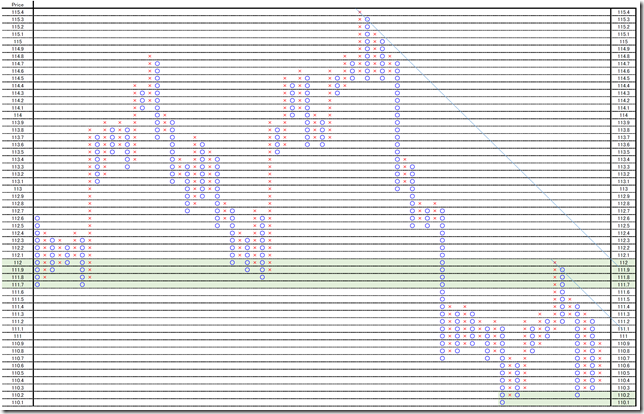
1枠0.1円、3枠転換の終値ポイントアンドフィギュアです。

1時間足を使用しオセアニア時間帯を省いています。

ブレーク待ちです。

112円超えから買い、110円割れから売りで攻めていきたい局面です。

This is 0.1 price change and 3 box reversal close price’s Point and Figure chart.

We used hourly data and the Oceania time zone market price is pulled out.

We need to waiting for a breaking.

Cutting 112yen over or going lower than 110yen will be a opportunity.

PF


相場分析のリクエストがありましたら“Contact Us”からお知らせください。ご要望にお応えできるように努力いたします。

このブログはあくまでも個人的な見解であり、投資判断は各自でお願い致します。当ブログは一切の投資損益に対する責任を負いません。

ホームページに来て下さってありがとうございます。明日もよろしくお願いいたします。

If you have some request to analyze, please write to “Contact Us”.

We do best effort for your request.

These are only personal opinions on this blog, and you need the investment judgment in each one. This blog doesn’t assume the responsibility to all the investment profit and loss.

Thank for watching our contents. My best regards next day.

如果您需要行情分析,请点击“Contact Us”联系我们。我们将尽力满足您的要求。

本博客仅为个人意见,请各自做出投资判断。本博客概不对任何投资盈亏负责。

感谢您访问本博客。欢迎再次使用。

© 2025 Retar