2017/05

ドル円週足・今なお戻り売りスタンスだが、115円までの戻しもありか?/USDJPY weekly; We are aiming recovery high but recovery seems to be 115yen around. /美元/日元。现在目标是恢复高点,但复苏似乎是115日元。

2017/05/07

ドル円週足・今なお戻り売りスタンスだが、115円までの戻しもありか?

USDJPY weekly; We are aiming recovery high but recovery seems to be 115yen around.

美元/日元。现在目标是恢复高点,但复苏似乎是115日元。


結論は円高に備えよ。だけど、もう少し時間がかかりそう。

また、116円台を超えてくると、125円ぐらいまで上昇する点も覚悟を。

Our conclusion is we need to preparing for Yen will be strong but need more time.

And cutting 116yen over, price may jump 125yen around.


今一番やりたいことは2017/2/9に発見したトレードアイディアです。

「ドル円週足・美味しそうなのは一旦111円を割れてからの戻り売り」

また、「ドル円週足トレンドライン・戻り高値は111円?114円?・111円では??」(2017/4/29)と報告しており、見通しに誤りがありました。

相場の景色が変化しており、考え方を改める必要があります。

というよりも、考えを変えるレッドラインを決定しておけば良い局面だとみています。

We suggested our best trade opportunity in 2/9/2017.

“USDJPY Weekly; The best selling point will be cutting 111yen once and recovering will be great opportunity”.

And we also reported “USDJPY weekly trend line; Recovery high is 111yen or 114yen? ; we think 111yen will be so” in 4/29/2017.

Our expectation was wrong.

Market environment may have already changed and we need to change our view.

Rather than now is the time to preparing for “Red Line”; what will be the trigger of .changing our view.


考えを改めるにあたり、現在のView の根拠になった点から点検する必要があります。

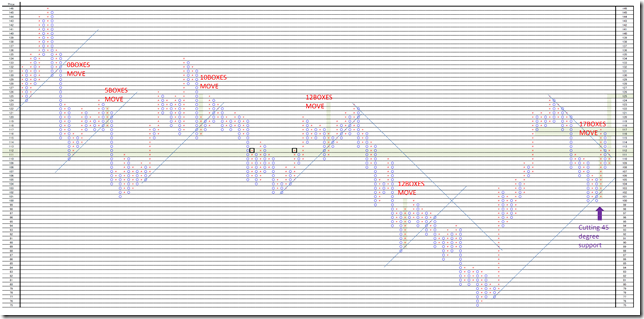
1枠1円、3枠転換の終値ポイントアンドフィギュアです。

1998年以降です。

45度線を割り込んでからの動きに注目すると、最近の戻しの大きいさがわかります。

10-12枠の戻しが多く、110円~112円への戻しは正常な位置です。

一方、一気に17枠戻すと、強気転換の可能性が生まれます。

このまま垂直17枠一気に戻すと125円となります。

When we need to change our view, we verify our evidences.

This is 1 price change and 3 box reversal close price’s Point and Figure chart after 1998.

We can know the latest 45 degree cutting was big recovery.

From 10 to 12 boxes recovery was major moving and it seems to be natural that the latest recovery is from 110yen to 112yen.

On the other hand, vertical 17 boxes move may occur and this will be strong bull signal.

The target is 125yen around.

PF


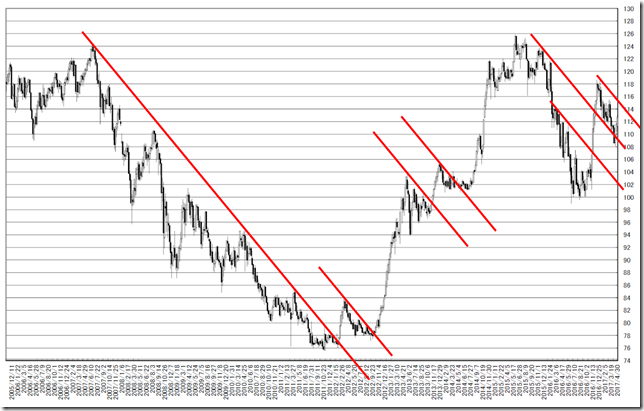
赤の角度こそ、本物臭さが漂うとみています。

長期のトレンドラインでは115円程度の戻しまでは弱気維持です。

The red lines must be a real meaning.

And if the price will not go over 115yen, bear trend will continue.

chart1


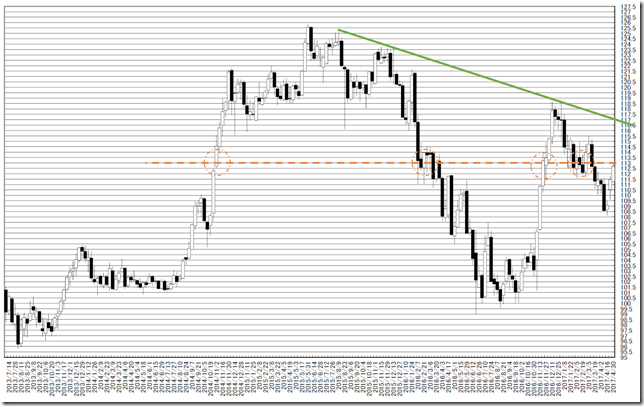
112円台の値動きでは実体抜きがあれば、上に伸びていくようです。

116円highに3点支えの地点があるため、注目に値します。

Cutting with candle stick body at 112yen around, this will be the signal of starting bull trend.

Green line is three pointed resistance and this will be notable resistance.

chart2


相場分析のリクエストがありましたら“Contact Us”からお知らせください。ご要望にお応えできるように努力いたします。

このブログはあくまでも個人的な見解であり、投資判断は各自でお願い致します。当ブログは一切の投資損益に対する責任を負いません。

ホームページに来て下さってありがとうございます。明日もよろしくお願いいたします。

If you have some request to analyze, please write to “Contact Us”.

We do best effort for your request.

These are only personal opinions on this blog, and you need the investment judgment in each one. This blog doesn’t assume the responsibility to all the investment profit and loss.

Thank for watching our contents. My best regards next day.

如果您需要行情分析,请点击“Contact Us”联系我们。我们将尽力满足您的要求。

本博客仅为个人意见,请各自做出投资判断。本博客概不对任何投资盈亏负责。

感谢您访问本博客。欢迎再次使用。


NY金中長期・1300ポイントに再び乗せるとブルトレンド入り濃厚/NY GOLD mid-to-long term; if the price will be 1300 point over, this may start a new bull trend. /中期和长期展望。纽约黄金。如果价格将达到1300点,就这可能开始一个新的牛市走势。

2017/05/06

NY金中長期・1300ポイントに再び乗せるとブルトレンド入り濃厚

NY GOLD mid-to-long term; if the price will be 1300 point over, this may start a new bull trend.

中期和长期展望。纽约黄金。如果价格将达到1300点,就这可能开始一个新的牛市走势。


本日はNY Goldについてです。

結論は「週明けからトレンドリバースすると、超長期の上方ブレークとなる可能性も」。

週明けは日柄的にも、もうワンチャンス上に向いても不思議なし。

また、再び下落するシナリオもありの分水嶺。

Today is about NY Gold.

Our conclusion is “if the trend will reverse from the next week, this may start a new long-term bull trend”.

From “HIGARA” view, there will be a chance to challenge higher price.

And now is the watershed of the market; this market may re-fall.


既に景色が変わっているとみています。」(2017/1/31レポート)

「息の長い相場は始まっているとみているため、押しは買い向かいたいと思います。」(2017/2/27報告)

We reported “We think this market trend seems to have already changed” in 1/31/2017.

And we also reported “We are bullish and dip will be a great opportunity” in 2/27/2017.


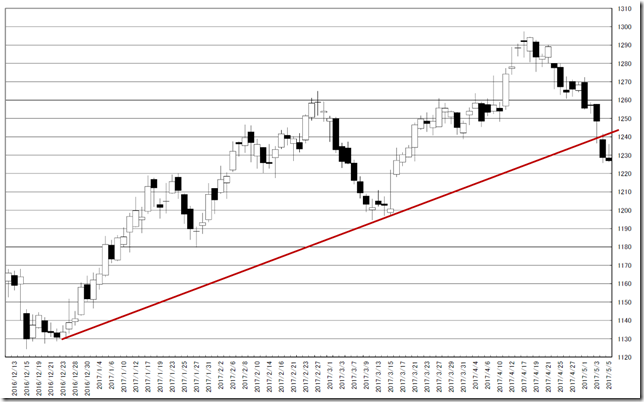
日足のトレンドラインでは、メジャーサポートを切っており、再び安値を試しそうな型です。

In daily chart, the price cut the major support and may try lower.

chart1


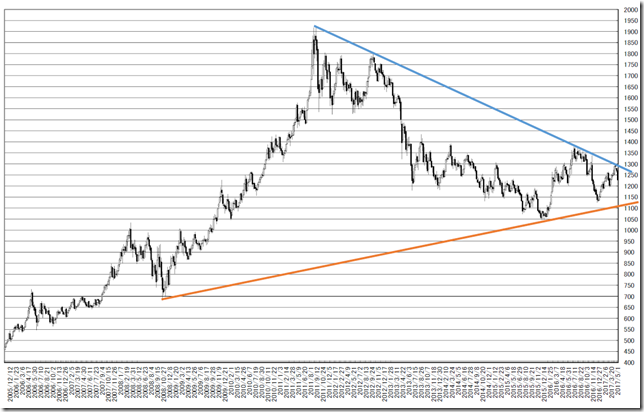
また、週足で確認すると、最外郭にタッチして下げています。

超えてしまうと2011年のピークからのトレンドラインを抜けることになるため、なかなか許してもらえません。

現在は正常な押しだとみる根拠です。

And in weekly chart, the price touched the most outer resistance line.

Cutting it will mean a new bull trend and seems to be difficult; the start of this line is 2011 and very long term worked.

This is the reason why we think “Now is dip!”

chart2


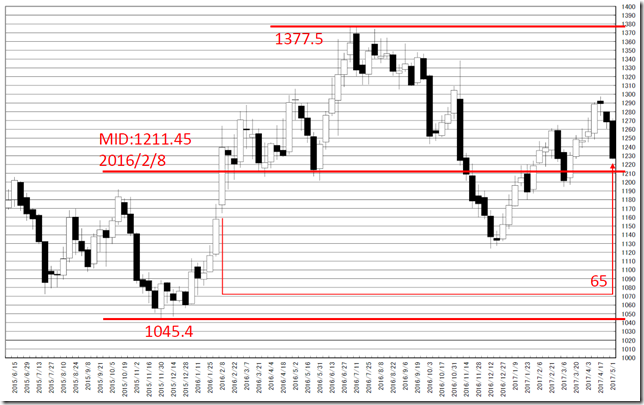
2016/2/8の週基点の持ち合いです。

先週で65手ですが、半値に届かずにいます。

このまま、半値タッチせず上伸すると強力な上伸シグナルとなります。

Starting is 2/8/2016 week.

It took 65 weeks in last week but the price cannot touch the half price.

If the price will not touch the half price, this will be the strong bull signal.

chart3


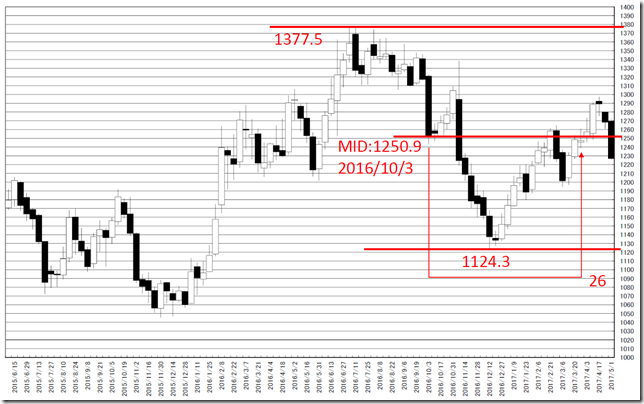
2016/10/3の週基点の持ち合いです。

26手を超えて上伸しているため、上値への期待がもてます。

Starting is 10/3/2016 week.

It took 26 weeks in 3/27/2016 week and rally continued after that; we can expect rally continue more.

chart4


相場分析のリクエストがありましたら“Contact Us”からお知らせください。ご要望にお応えできるように努力いたします。

このブログはあくまでも個人的な見解であり、投資判断は各自でお願い致します。当ブログは一切の投資損益に対する責任を負いません。

ホームページに来て下さってありがとうございます。明日もよろしくお願いいたします。

If you have some request to analyze, please write to “Contact Us”.

We do best effort for your request.

These are only personal opinions on this blog, and you need the investment judgment in each one. This blog doesn’t assume the responsibility to all the investment profit and loss.

Thank for watching our contents. My best regards next day.

如果您需要行情分析,请点击“Contact Us”联系我们。我们将尽力满足您的要求。

本博客仅为个人意见,请各自做出投资判断。本博客概不对任何投资盈亏负责。

感谢您访问本博客。欢迎再次使用。

© 2025 Retar