2017/05

日経平均週足・羽黒1号線・高値圏の「ハラミ&包み」はリバーサル臭い/NIKKEI 225 weekly is “HAGURO” No.1 formation; At higher zone, “Engulfing bar” and “Inside bar” often became reversal signal. /日经225。羽黑1号线。反转信号。

2017/05/26

日経平均週足・羽黒1号線・高値圏の「ハラミ&包み」はリバーサル臭い

NIKKEI 225 weekly is “HAGURO” No.1 formation; At higher zone, “Engulfing bar” and “Inside bar” often became reversal signal.

日经225。羽黑1号线。反转信号。


本日は日経225についてです。

Today is about N225 daily.


「日経平均週足・羽黒5号線・20000円台があっても、ひとまずワンタッチか?」(2017/5/14)

「日経平均週足・羽黒16(10)号線・19592.9円より下に入ってきたので弱気」(2017/5/19)

基本的には弱気筋なので、”Sell on high”です。

とは言っても、おおよそ19592.9円でサポートされましたと言うことだったようです。

We reported “NIKKEI 225 weekly is “HAGURO” No.5 formation; 20000yen over will be “once touch” for a while” in 5/14/2017.

We reported “NIKKEI 225 weekly is “HAGURO” No.16(10) formation; the close price of this week is lower than 19592.9yen and this will be bearish signal” in 5/19/2017.

We are bearish and our basic tactics is “Sell on high”.

But about 19592.9yen worked well as support point.


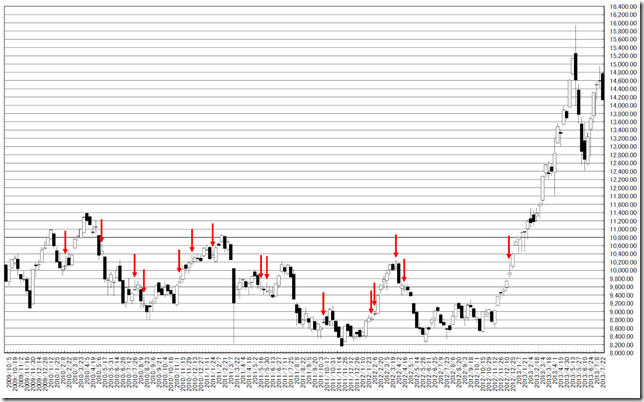
日経225週足線は羽黒1号線となりました。

日経225週足線では400週で羽黒1号線は26回出現しています。

最近の傾向は高値圏で示現すると上値を抑え込まれるようです。

週末終値20000円強にならない限り、強気にはなれません。

In this week, N225 formed “HAGURO” No. 1 formation.

In past 400 weeks, N225 price formed “HAGURO” No.1 formation was 26 times.

When this formation appeared in higher zone, rally was ended.

Unless the price will cut 20000yen over in close price, we cannot become bullish.

chart1chart2


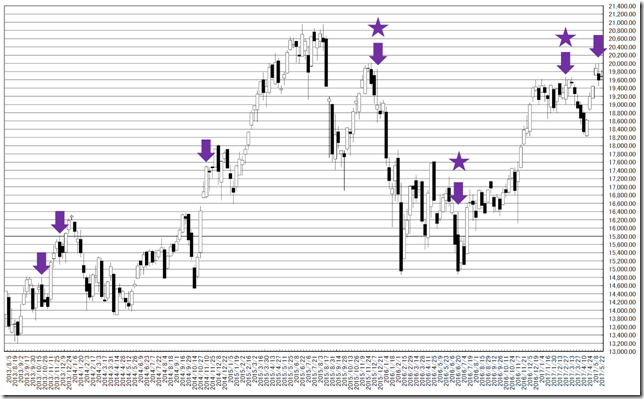
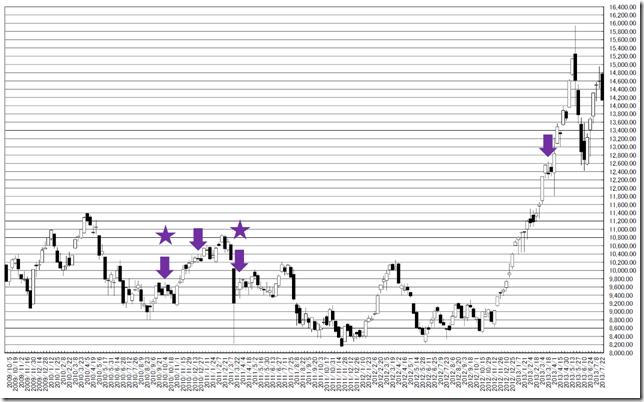
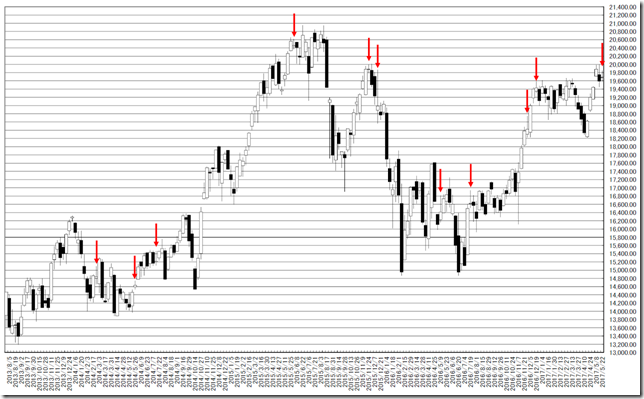
ハラミと包みとなりました。(矢印の地点)

2017/3/10には「ハラミと包み」について「未だトレンドは出ていないとみています。」と報告しています。

しかし、今回のパターンでは20000円の鉄板さ加減が強烈です。

トレンドの発生地点として申し分ないとみています。

The price forms “Engulfing bar” and “Inside bar”. (Arrow points)

We reported about “Engulfing bar” and “Inside bar” in 3/10/2017 and concluded “Major trend is not revealed”.

But in the latest case, 20000yen seems to be strong resistance.

And bearish trend seems to be edge.

chart3chart4


相場分析のリクエストがありましたら“Contact Us”からお知らせください。ご要望にお応えできるように努力いたします。

このブログはあくまでも個人的な見解であり、投資判断は各自でお願い致します。当ブログは一切の投資損益に対する責任を負いません。

ホームページに来て下さってありがとうございます。明日もよろしくお願いいたします。

If you have some request to analyze, please write to “Contact Us”.

We do best effort for your request.

These are only personal opinions on this blog, and you need the investment judgment in each one. This blog doesn’t assume the responsibility to all the investment profit and loss.

Thank for watching our contents. My best regards next day.

如果您需要行情分析,请点击“Contact Us”联系我们。我们将尽力满足您的要求。

本博客仅为个人意见,请各自做出投资判断。本博客概不对任何投资盈亏负责。

感谢您访问本博客。欢迎再次使用。


上海総合指数週足・バブル崩壊後にどうなったか?(12)・早くて晩秋以降に2000ポイント付近の様相/SSE Composite Index (Shanghai: 000001.SS) Weekly (12); the price will reach 2000 point around after this late fall. /上证指数。泡沫破裂后,变成了怎样?第12部。这个深秋后的价格将达到2000点。

2017/05/25

上海総合指数週足・バブル崩壊後にどうなったか?(12)・早くて晩秋以降に2000ポイント付近の様相

SSE Composite Index (Shanghai: 000001.SS) Weekly (12); the price will reach 2000 point around after this late fall.

上证指数。泡沫破裂后,变成了怎样?第12部。这个深秋后的价格将达到2000点。


本日は上海総合指数についてです。

2015/07/19と2015/10/06と2015/10/29と2015/11/28と2016/1/29と2016/03/30と2016/5/12と2016/08/18と2016/11/04と2017/1/25と2017/4/5のレポートでは「上海総合指数週足・バブル崩壊後にどうなったか?・日経、ダウ工業株と比較(1)から(11)」について紹介しました。

本日はその後の様子について報告します。

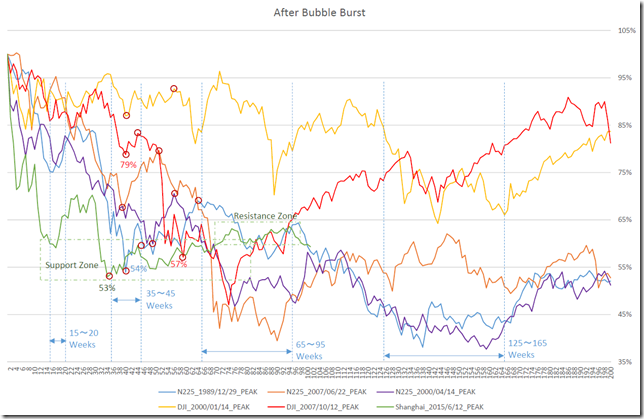
結論は「4月末に変化した模様。晩秋以降に2000ポイント付近に向かいそう」。

Today’s analyze is SSE Composite Index weekly data.

We reported “SSE Composite Index (Shanghai: 000001.SS) Weekly; After Bubble Burst, what it would be?; Comparing N225 and DJI” in 07/19/2015, 10/06/2015, 10/29/2015, 11/28/2015, 1/29/2016, 03/30/2016, 5/12/2016, 8/18/2016, 11/4/2016, 1/25/2017 and 4/5/2017.

Today, we introduce what happened after that.

Our conclusion is “At the end of April 2017, this market got into ‘HENKABI’ zone. The price will reach 2000point around after late fall”.


大天井から今週で101週です。

天井からの60%(3099.81point)を割り込んできました。

101週を日経平均に例えるなら、気分は1991/11/29の週、クローズ22687円でした。

日経平均の場合、138週(1992/8/14の週)に14820円の底をとりました。

上海の場合、天井からの下げスピードが速かった点を考慮して、120週を超えた点から大底に備えると、早くて5ヶ月先です。

その時点の底値は、天井からの4割 (5166.35*0.4=2066.54)を想定しています。

2000ポイントより割れたところは、買い場になるとみています。

This week is 101th weeks from the major peak.

The price cut 60% (3099.81point) from the peak.

Quoting N225, 101 weeks means 11/29/1991 week and the close price was 22687yen.

N225 took the bottom in 138 weeks (8/14/1992 week) and the close price was 14820yen.

In Shanghai case, this market was sharp fall and may take sharp bottom; this market will take bottom 120weeks over and this means about 5 months after from now.

The bottom price will be 40% (5166.35*0.4=2066.54) from the peak.

Of course, cutting 2000 point will be great buying opportunity.

chart


相場分析のリクエストがありましたら“Contact Us”からお知らせください。ご要望にお応えできるように努力いたします。

このブログはあくまでも個人的な見解であり、投資判断は各自でお願い致します。当ブログは一切の投資損益に対する責任を負いません。

ホームページに来て下さってありがとうございます。明日もよろしくお願いいたします。

If you have some request to analyze, please write to “Contact Us”.

We do best effort for your request.

These are only personal opinions on this blog, and you need the investment judgment in each one. This blog doesn’t assume the responsibility to all the investment profit and loss.

Thank for watching our contents. My best regards next day.

如果您需要行情分析,请点击“Contact Us”联系我们。我们将尽力满足您的要求。

本博客仅为个人意见,请各自做出投资判断。本博客概不对任何投资盈亏负责。

感谢您访问本博客。欢迎再次使用。

© 2024 Retar