2017/07

日経平均週足・羽黒3号線・またもやトレンドお預け、しかし、ブレークは近いはず/NIKKEI 225 weekly is “HAGURO” No.3 formation; Trendless again but breaking will be sooner. /日经225。羽黑3号线。现在是没有趋势,可是一段时间后出现趋势。

2017/07/21

日経平均週足・羽黒3号線・またもやトレンドお預け、しかし、ブレークは近いはず

NIKKEI 225 weekly is “HAGURO” No.3 formation; Trendless again but breaking will be sooner.

日经225。羽黑3号线。现在是没有趋势,可是一段时间后出现趋势。


本日は日経225についてです。

結論は、本物はハラミの抜けだが、下方向への崩れを警戒。

Today is about N225 Weekly.

Our conclusion is true trend will cutting “Inside day” but there is down side risk.


「日経平均・過去をなぞるなら20000円超の値もちはどんなに長くても今年10月末まで?・20200円を超えたらとりあえずLong」(2017/6/8)

2017/6/20には、「本日は20200円の終値を超えてきましたが、週末まで20200円をKeepできるか注目です。週足終値で20200円超をキープできると、Rally startとみています。」と報告しています。

今週の高値は20157.11円。相変わらず20200円は近くて遠い。

We reported “N225 historically; keeping 20000yen over may be end of October at longest; 20200yen over will be buying opportunity” in 6/8/2017.

We reported “Today, the market price went 20200yen over in close price and keeping 20200yen over in weekend close will start a new rally” in 6/20/2017

The highest in this week was20157.11yen and 20200yen is still close but keeping is difficult.


「日経平均週足・羽黒7号線・「下へ上へ」の大暴れの前兆?・またもやハラミからの抜けなくトレンドレス」(2017/6/23)も有効です。

We reported “NIKKEI 225 weekly is “HAGURO” No.7 formation; Rampaging?; But price does also cut “Inside day”; trend less again” in 6/23/2017 and this report is still valid.


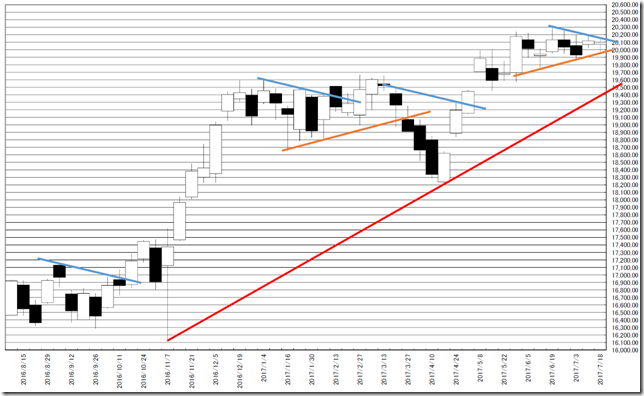
トレンドラインです。

5月下旬からの三角持ち合いです。

青はフェイクもあるので要注意。

しかし、そろそろ煮詰まり感が出ています。

This is trend line analysis.

The price forms pennant formation at the end of May.

Cutting blue line may be fake.

But now is tying up.

chart1


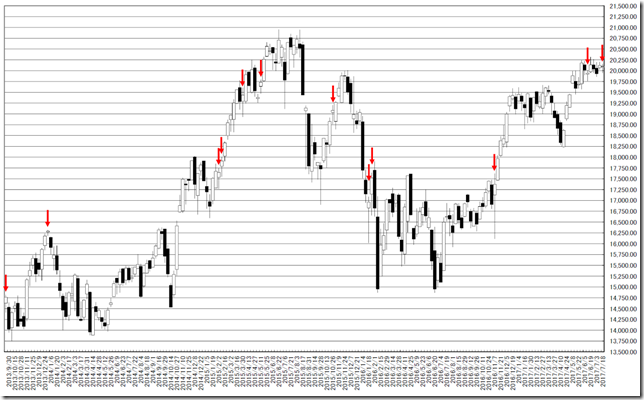
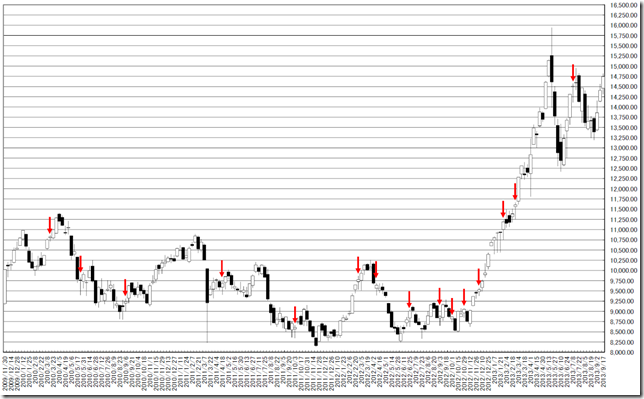
日経225週足線は羽黒3号線となりました。

日経225週足線では400週で羽黒3号線は27回出現しています。

この2か月つまらないレポートばかりでそろそろ飽き飽きしてきます。

基本的に底堅そうです、しかし、ハラミの出来事です。

In this week, N225 formed “HAGURO” No. 3 formation.

In past 400 weeks, N225 price formed “HAGURO” No. 3 formation was 27 time.

You may bore our report in latest 2 months but this is only fact.

Now seems to be stable market but this occasion is only occurred in “Inside day”.

chart2

chart3


相場分析のリクエストがありましたら“Contact Us”からお知らせください。ご要望にお応えできるように努力いたします。

このブログはあくまでも個人的な見解であり、投資判断は各自でお願い致します。当ブログは一切の投資損益に対する責任を負いません。

ホームページに来て下さってありがとうございます。明日もよろしくお願いいたします。

If you have some request to analyze, please write to “Contact Us”.

We do best effort for your request.

These are only personal opinions on this blog, and you need the investment judgment in each one. This blog doesn’t assume the responsibility to all the investment profit and loss.

Thank for watching our contents. My best regards next day.

如果您需要行情分析,请点击“Contact Us”联系我们。我们将尽力满足您的要求。

本博客仅为个人意见,请各自做出投资判断。本博客概不对任何投资盈亏负责。

感谢您访问本博客。欢迎再次使用。


東京白金先物月足・今月陰線だと美味しい買い場の可能性/Tokyo Platinum Future Monthly; when candle stick color will be black in this month, this occasion may imply great buying opportunity. /东京市场的铂。因为当蜡烛棒的颜色在本月将是黑色的,就可能意味着很大的购买机会。

2017/07/20

東京白金先物月足・今月陰線だと美味しい買い場の可能性

Tokyo Platinum Future Monthly; when candle stick color will be black in this month, this occasion may imply great buying opportunity.

东京市场的铂。因为当蜡烛棒的颜色在本月将是黑色的,就可能意味着很大的购买机会。


本日は東京白金先物月足の分析です。

結論は、今月陰線を引くと下げ止まりの可能性あり、しかも長期的な大底の可能性含み。

Today, we analyze Tokyo Platinum Future monthly data.

Our conclusion is when candle stick color will be black in this month, this occasion will be great buying opportunity and this may be mid-to-long term bottom.


商品相場がそろってピヨピヨと囀るときは要注意です。

2017/5/11に「東京白金先物日足P&F・レジスタンス3700ポイント・下げ止まりかも」と報告しています。

下げてはいますが、「頭と尻尾」程度の下げです。

2017/7/4に「シカゴ大豆期近・中長期・カナリアが鳴く・底割れするのか興味深い地点」と報告しています。

2017/7/12に「シカゴ大豆期近・中長期・夏の買い上がりは底堅さの示唆では?」と報告しています。

Commodity markets alert us some mid-to-long term signals.

We reported “Tokyo Platinum Future Daily P&F; the resistance point are 3700 point; this market may stop falling” in 5/11/2017.

The price is falling but this is only bit.

We reported “Chicago soybean nearby; mid-to-long term; now is notable watershed going lower or not” in 7/4/2017.

We reported “Chicago soybean nearby; mid-to-long term; summer rally seems to suggest stable market” in 7/12/2017.


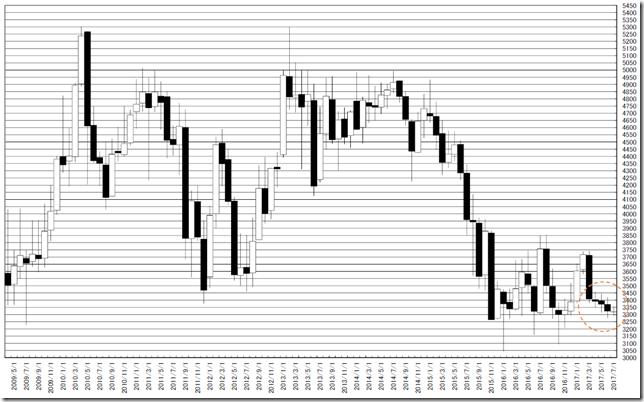
はじめに100ヶ月のチャートを確認すると、4月以降に急速に月々のボラティティが低下しています。

今月は既に20日になりますが、未だ先月のハラミの中です。

This is 100 months chart and now is low volatility after April.

It took 20 days from the beginning of July but the price was wrapped by last month.

chart1


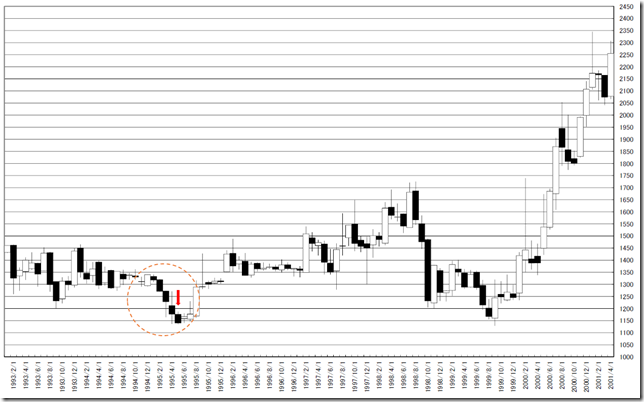
現在のチャートとなんとなく雰囲気が似ているのが1995年の底です。

陰線5手目でハラミとなり下げ止まっています。

The similar case was 1995 case.

The price formed 5 lining black candle sticks.

chart2


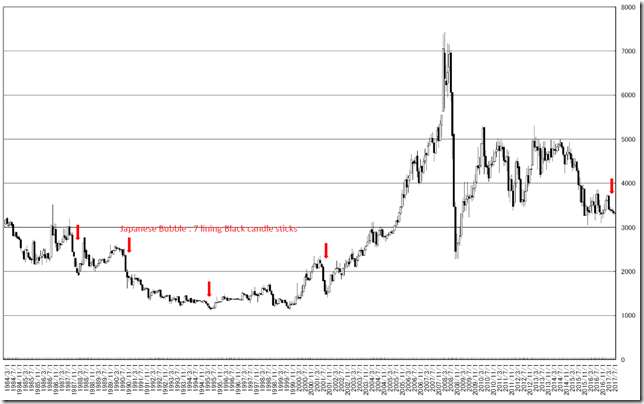
1984年以降の月足陰線5手だけを集めてみると、バブル崩壊を除き、美味しい買い場であったことがわかります。

いずれにせよ、刺激的な相場は近いとみています。

After 1984, we mark 5 lining black candle sticks points and can know it was great buying opportunities excepting Japanese Bubble.

In any way, stimulus market will come sooner.

chart3


相場分析のリクエストがありましたら“Contact Us”からお知らせください。ご要望にお応えできるように努力いたします。

このブログはあくまでも個人的な見解であり、投資判断は各自でお願い致します。当ブログは一切の投資損益に対する責任を負いません。

ホームページに来て下さってありがとうございます。明日もよろしくお願いいたします。

If you have some request to analyze, please write to “Contact Us”.

We do best effort for your request.

These are only personal opinions on this blog, and you need the investment judgment in each one. This blog doesn’t assume the responsibility to all the investment profit and loss.

Thank for watching our contents. My best regards next day.

如果您需要行情分析,请点击“Contact Us”联系我们。我们将尽力满足您的要求。

本博客仅为个人意见,请各自做出投资判断。本博客概不对任何投资盈亏负责。

感谢您访问本博客。欢迎再次使用。

© 2025 Retar