2017/07

ドル円1時間足・112円middle、113円highに窓・上がりだしたらついていく/USDJPY hourly; there are gaps at 112yen middle and 113yen high; rally will start, we will follow. /美元/日元。缺口是112日元中间和113日元高。如果反弹将开始,就我们会跟随。

2017/07/19

ドル円1時間足・112円middle、113円highに窓・上がりだしたらついていく

USDJPY hourly; there are gaps at 112yen middle and 113yen high; rally will start, we will follow.

美元/日元。缺口是112日元中间和113日元高。如果反弹将开始,就我们会跟随。


本日はドル円についてです。

結論は上がりだしたら買う。

Today, we analyze USDJPY.

Our conclusion is rally will start, we will follow.


「ドル円週足・中長期・新高値なら円高見通し豹変・117円がみえてくる」(2017/7/2)と報告しており、考え方を改める段階です。

「バリバリの円高派」はやめました。

考え方を改める時だとみており、持ち合いでも、上がりだしても、下がりだしてもビックリしないのがメインシナリオです。

札幌も暑いので、考えがまとまり次第、報告したいと思います。

We reported “USDJPY Weekly; Mid-to-long term; taking new high, we will change our view; targets is 117yen” in 7/2/2017 and we need to change our mind.

We resign “Yen Longer”.

Now is the time to change our mind and we will not surprise rally or falling.

We are rebuilding our tactics.


とは言っても相場にはヒントがいっぱいあるものです。

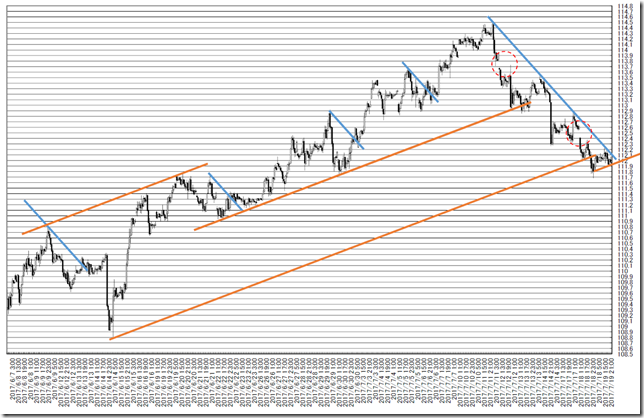
トレンドラインです。

1時間足では、窓を残しているので、113円HIGHまで戻るのは当然だとみています。

青を超えたら、まずは買っていこうとなると思います。

But there remains many evidence on the chart!

This is trend line analysis.

There remains two gaps and it will be natural the price will recover 113yen high.

Cutting blue line will be buying opportunity.

chart1


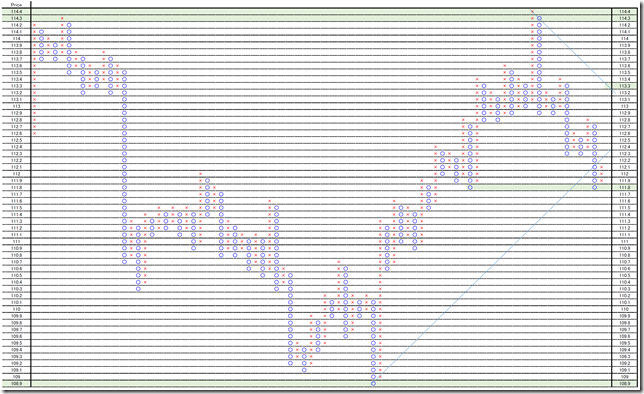
1枠0.1円、3枠転換の終値ポイントアンドフィギュアです。

1時間足を使用しオセアニア時間帯を省いています。

メジャーの45度線を超えているため、まずは持ち合い、下落の局面です。

ダブルボトムを打っているので、下げ止まりかもしれません。

細かくとっていく相場だとみています。

This is 0.1 price change and 3 box reversal close price’s Point and Figure chart.

We used hourly data and the Oceania time zone market price is pulled out.

The price cut the major resistance and now is steadiness or falling.

And the price took double dip and may stop falling.

We will take small price range.

PF


相場分析のリクエストがありましたら“Contact Us”からお知らせください。ご要望にお応えできるように努力いたします。

このブログはあくまでも個人的な見解であり、投資判断は各自でお願い致します。当ブログは一切の投資損益に対する責任を負いません。

ホームページに来て下さってありがとうございます。明日もよろしくお願いいたします。

If you have some request to analyze, please write to “Contact Us”.

We do best effort for your request.

These are only personal opinions on this blog, and you need the investment judgment in each one. This blog doesn’t assume the responsibility to all the investment profit and loss.

Thank for watching our contents. My best regards next day.

如果您需要行情分析,请点击“Contact Us”联系我们。我们将尽力满足您的要求。

本博客仅为个人意见,请各自做出投资判断。本博客概不对任何投资盈亏负责。

感谢您访问本博客。欢迎再次使用。


NY原油日足・54ポイントから42ポイントにかけてのレンジ相場?/West Texas Intermediate (WTI) Daily; the range is from 54 point to 42 point? /西德克萨斯中质油(WTI)。范围是从54点到42点。

2017/07/18

NY原油日足・54ポイントから42ポイントにかけてのレンジ相場?

West Texas Intermediate (WTI) Daily; the range is from 54 point to 42 point?

西德克萨斯中质油(WTI)。范围是从54点到42点。


本日はNY原油についてです。

Today’s analyze is West Texas Intermediate (WTI).


2016/08/03で紹介した通り、上の窓が埋まればラリースタートだとみています。

「NY原油・窓埋め失敗の鉄板天井?」(2017/1/24)とも報告しています。

「NY原油日足・鉄板天井確認?・サポート49ポイント」(2017/3/9)とも報告しています。

「NY原油日足・再び鉄板天井試し・レジスタンス54ポイント、サポート47ポイント」(2017/4/14)と報告しています。

上は鉄板、下限は40ポイント台前半の持ち合いがメインシナリオです。

We introduced burying upper side gap seems to start rally. (See 08/03/2016 report)

And we reported “West Texas Intermediate (WTI) P&F; Burying upper side big gap may fail and may be “Iron plated resistance”?” (See 1/24/2017) and “West Texas Intermediate (WTI) Daily; we can confirm “The Iron Plated resistance”? The support is 49 point” (See 3/9/2017).

We reported “West Texas Intermediate (WTI) Daily; the price is challenging “The Iron Plated resistance”; support is 47 point and resistance is 54point” in 4/14/2017.

Our main scenario is steadiness will continue and the upper side will be “Iron Plated” and the lower side will be 40 point low.


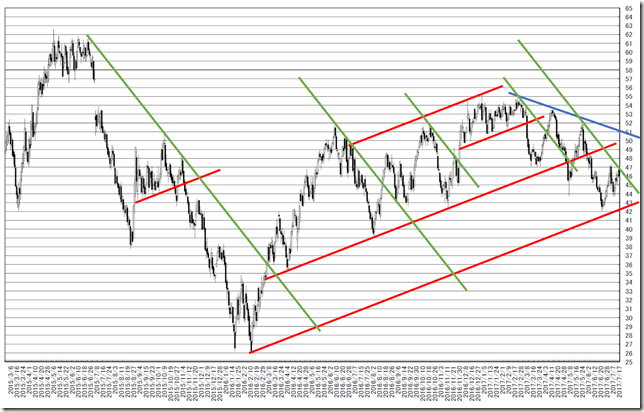
トレンドラインです。

昨日は緑まで戻しています。

再下落するのか、下げ止まるのか興味深い地点です。

超えてくると下げ止まりとなり、サポート下限は40ポイントとなりそうです。

This is trend line analysis.

Last day, the price recovered green line.

Now is the watershed of stop falling or re-falling.

Cutting will mean trend changing and 40 point around will work as support.

chart1


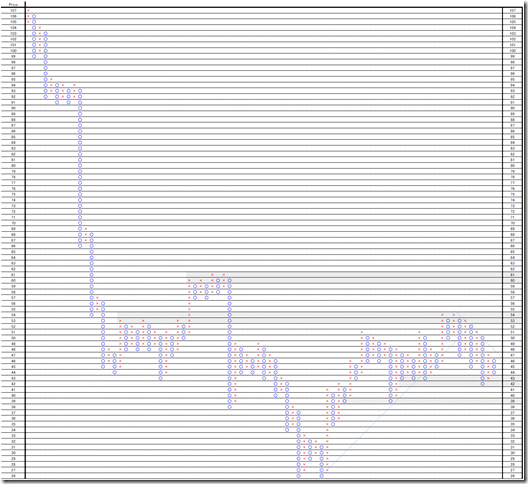
日足のポイントアンドフィギュアです。

1枠1ポイント、3枠転換の終値ポイントアンドフィギュアです。

「上堅く、下柔らかし」の相場であり、売り場はわかりやすのですが、いつから買い出動になるのかわかりづらい。

サポート地点は、39ポイント、42-43ポイント。

レジスタンス地点は、53-54ポイントです。

This is Point and Figure chart written by daily data.

This is 1 point price change and 3 box reversal close price’s Point and Figure chart.

We can know the selling point but we do not know the true support.

The supports are 39 point and 42-43 point and resistance is 53-54 point.

PF


相場分析のリクエストがありましたら“Contact Us”からお知らせください。ご要望にお応えできるように努力いたします。

このブログはあくまでも個人的な見解であり、投資判断は各自でお願い致します。当ブログは一切の投資損益に対する責任を負いません。

ホームページに来て下さってありがとうございます。明日もよろしくお願いいたします。

If you have some request to analyze, please write to “Contact Us”.

We do best effort for your request.

These are only personal opinions on this blog, and you need the investment judgment in each one. This blog doesn’t assume the responsibility to all the investment profit and loss.

Thank for watching our contents. My best regards next day.

如果您需要行情分析,请点击“Contact Us”联系我们。我们将尽力满足您的要求。

本博客仅为个人意见,请各自做出投资判断。本博客概不对任何投资盈亏负责。

感谢您访问本博客。欢迎再次使用。

© 2025 Retar