2017/07

上海総合指数週足・バブル崩壊後にどうなったか?(13)・戻りいっぱいの様相/SSE Composite Index (Shanghai: 000001.SS) Weekly (13); Now seems to be recovery high. /上证指数。泡沫破裂后,变成了怎样?第13部。

2017/07/16

上海総合指数週足・バブル崩壊後にどうなったか?(13)・戻りいっぱいの様相

SSE Composite Index (Shanghai: 000001.SS) Weekly (13); Now seems to be recovery high.

上证指数。泡沫破裂后,变成了怎样?第13部。


本日は上海総合指数についてです。

2015/07/19と2015/10/06と2015/10/29と2015/11/28と2016/1/29と2016/03/30と2016/5/12と2016/08/18と2016/11/04と2017/1/25と2017/4/5と2017/5/25のレポートでは「上海総合指数週足・バブル崩壊後にどうなったか?・日経、ダウ工業株と比較(1)から(12)」について紹介しました。

本日はその後の様子について報告します。

結論は「戻り天井いっぱいの様相」。

Today’s analyze is SSE Composite Index weekly data.

We reported “SSE Composite Index (Shanghai: 000001.SS) Weekly; After Bubble Burst, what it would be?; Comparing N225 and DJI” in 07/19/2015, 10/06/2015, 10/29/2015, 11/28/2015, 1/29/2016, 03/30/2016, 5/12/2016, 8/18/2016, 11/4/2016, 1/25/2017, 4/5/2017 and 5/25/2017.

Today, we introduce what happened after that.

Our conclusion is “Now seems recovery high”.


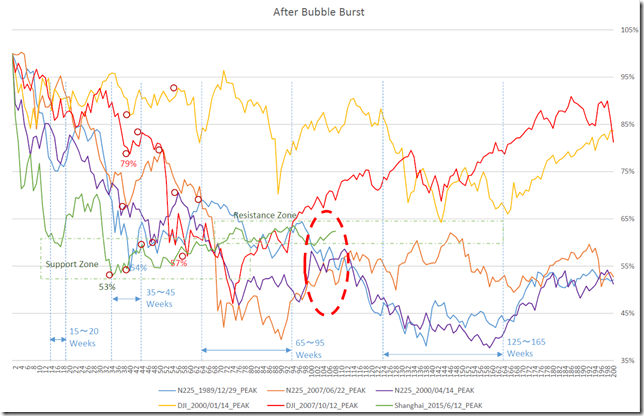
大天井から今週で109週です。

現在までにわかったことは2007年のDJIのような昇竜拳が期待できない状況である点がわかります。

他のバブルも現在の時間帯は、高値圏を維持する時間帯であったことがわかります。(赤丸)

2017/5/25に「上海総合指数週足・バブル崩壊後にどうなったか?(12)・早くて晩秋以降に2000ポイント付近の様相」と報告していますが、見通しを維持したいと思います。

This week is 109th weeks from the major peak.

We can know we cannot expect a big rally like 2007 DJI.

In other bubble occasions in same time, now was the high price zone. (Red circle)

We reported “SSE Composite Index (Shanghai: 000001.SS) Weekly (12); the price will reach 2000 point around after this late fall” in 5/25/2017 and we keep this view.

chart


相場分析のリクエストがありましたら“Contact Us”からお知らせください。ご要望にお応えできるように努力いたします。

このブログはあくまでも個人的な見解であり、投資判断は各自でお願い致します。当ブログは一切の投資損益に対する責任を負いません。

ホームページに来て下さってありがとうございます。明日もよろしくお願いいたします。

If you have some request to analyze, please write to “Contact Us”.

We do best effort for your request.

These are only personal opinions on this blog, and you need the investment judgment in each one. This blog doesn’t assume the responsibility to all the investment profit and loss.

Thank for watching our contents. My best regards next day.

如果您需要行情分析,请点击“Contact Us”联系我们。我们将尽力满足您的要求。

本博客仅为个人意见,请各自做出投资判断。本博客概不对任何投资盈亏负责。

感谢您访问本博客。欢迎再次使用。


日経平均週足・羽黒2号線・まだまだハラミの中・トレンドライン的には崩れ臭い/NIKKEI 225 weekly is “HAGURO” No.2 formation; Still “Inside day”; But may break down side from trend line view. /日经225。羽黑2号线。仍然不启动、但可以从趋势线视图打破侧。

2017/07/15

日経平均週足・羽黒2号線・まだまだハラミの中・トレンドライン的には崩れ臭い

NIKKEI 225 weekly is “HAGURO” No.2 formation; Still “Inside day”; But may break down side from trend line view.

日经225。羽黑2号线。仍然不启动、但可以从趋势线视图打破侧。


本日は日経225についてです。

結論は、本物はハラミの抜けだが、下方向への崩れを警戒。

Today is about N225 Weekly.

Our conclusion is true trend will cutting “Inside day” but there is down side risk.


「日経平均・過去をなぞるなら20000円超の値もちはどんなに長くても今年10月末まで?・20200円を超えたらとりあえずLong」(2017/6/8)

2017/6/20には、「本日は20200円の終値を超えてきましたが、週末まで20200円をKeepできるか注目です。週足終値で20200円超をキープできると、Rally startとみています。」と報告しています。

今週の高値は20200.88円。相変わらず20200円は近くて遠い。

We reported “N225 historically; keeping 20000yen over may be end of October at longest; 20200yen over will be buying opportunity” in 6/8/2017.

We reported “Today, the market price went 20200yen over in close price and keeping 20200yen over in weekend close will start a new rally” in 6/20/2017

The highest in this week was 20200.88yen and 20200yen is still close but keeping is difficult.


「日経平均週足・羽黒7号線・「下へ上へ」の大暴れの前兆?・またもやハラミからの抜けなくトレンドレス」(2017/6/23)も有効です。

We reported “NIKKEI 225 weekly is “HAGURO” No.7 formation; Rampaging?; But price does also cut “Inside day”; trend less again” in 6/23/2017 and this report is still valid.


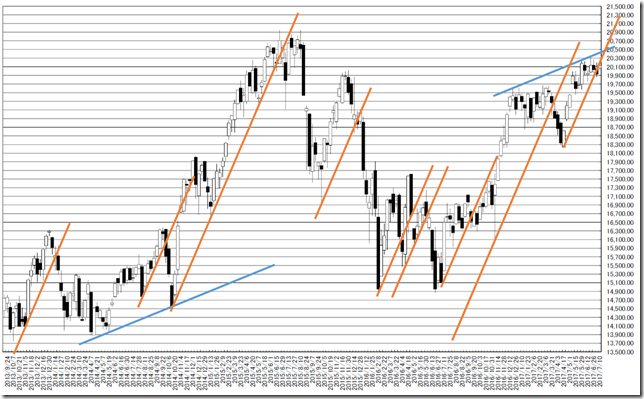
日経225週足線は羽黒2号線となりました。

日経225週足線では200週で羽黒2号線は36回出現しています。

単体では判別不能の線です。

In this week, N225 formed “HAGURO” No.2 formation.

In past 200 weeks, N225 price formed “HAGURO” No.2 formation was 36 time.

Single formation does not have no mean.


しかし、20200円を鉄板天井にしていると、重要なサポートはいつのまにか切れてしまいます。

オレンジの切れは、下落シグナルです。

But 20200 yen works well and this means cutting the important support at all.

Cutting orange means falling signal.

chart1


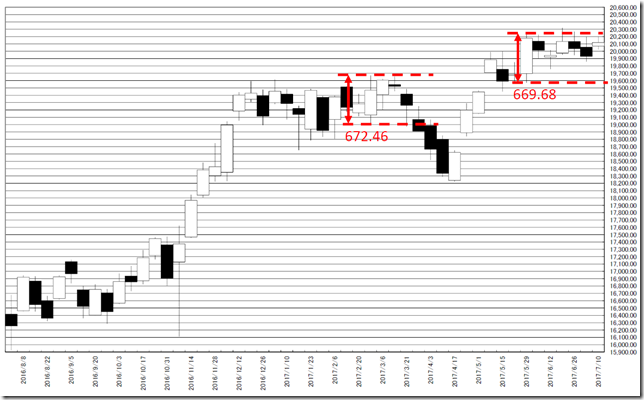
ほかにも、似たような値幅のハラミが最近もありました。

In other case, we can see similar “Inside Day and similar price range.

chart2


相場分析のリクエストがありましたら“Contact Us”からお知らせください。ご要望にお応えできるように努力いたします。

このブログはあくまでも個人的な見解であり、投資判断は各自でお願い致します。当ブログは一切の投資損益に対する責任を負いません。

ホームページに来て下さってありがとうございます。明日もよろしくお願いいたします。

If you have some request to analyze, please write to “Contact Us”.

We do best effort for your request.

These are only personal opinions on this blog, and you need the investment judgment in each one. This blog doesn’t assume the responsibility to all the investment profit and loss.

Thank for watching our contents. My best regards next day.

如果您需要行情分析,请点击“Contact Us”联系我们。我们将尽力满足您的要求。

本博客仅为个人意见,请各自做出投资判断。本博客概不对任何投资盈亏负责。

感谢您访问本博客。欢迎再次使用。

© 2025 Retar