2017/10

ドル円1時間足・もう少し上はあると思うが、113.40-.30円から110.80-70円のレンジ/USDJPY hourly; Rally will continue for little bit and now is range market from 113.40-.30yen to 110.80-70yen. /美元/日元。拉力赛将继续点点。现在是范围市场从113.40-.30日元到110.80-70日元。

2017/10/11

ドル円1時間足・もう少し上はあると思うが、113.40-.30円から110.80-70円のレンジ

USDJPY hourly; Rally will continue for little bit and now is range market from 113.40-.30yen to 110.80-70yen.

美元/日元。拉力赛将继续点点。现在是范围市场从113.40-.30日元到110.80-70日元。


本日はドル円についてです。

結論は上値の重さが出てきている。113円HIGHまで伸び、その後は落っこちそうでは?とみています。

例えば114円ワンタッチの後、下の窓埋めがメインシナリオです。

急落、急騰ともに考慮するべき局面であるのは確かです。

Today, we analyze USDJPY.

Our conclusion is now seems to be rounding and rally will be end at 113yen high and will fall?

For example, the price may touch 114yen around and will take lower gaps after that.

Sharp jump or fall may occur.


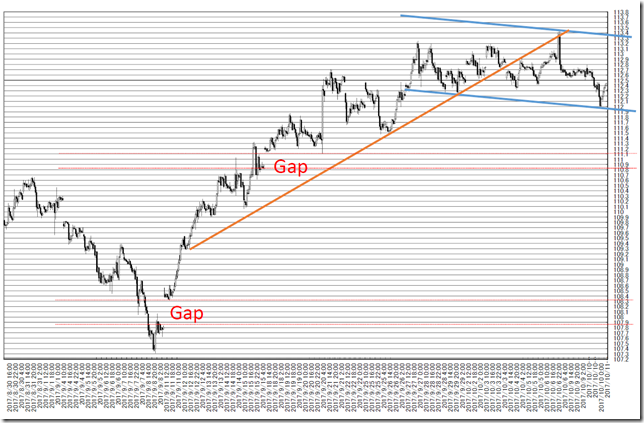
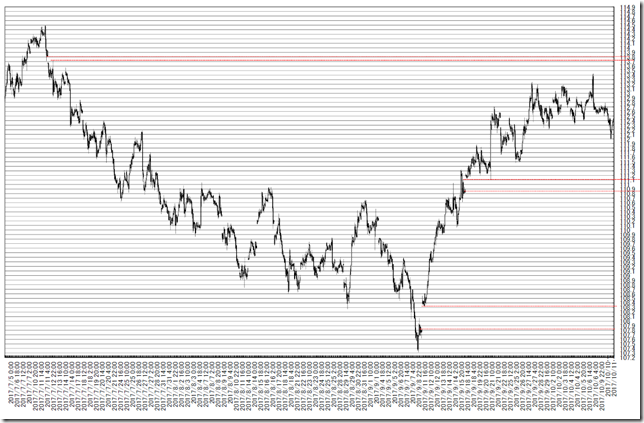
1時間足を使用しオセアニア時間帯を省いています。

窓が残っているので埋まるのがメインシナリオです。

上の窓を埋めてから下の窓の順番になるとみています。

一番上の窓は113円highにあるため、埋めにかかる可能性を秘めます。

一方、下方向にも窓を残しているため、いつかは埋まるものだとみています。

We used hourly data and the Oceania time zone market price is pulled out.

There remain two gaps and our main scenario is these will bury.

The upper side gaps will bury first and lower side will bury after that.

The highest gap exists 113 high and the price may reach.

On the other hand, there is a gap in down side and this gap will bury in future.

chart1


1時間足を使用しオセアニア時間帯を省いています。

トレンドラインです。

調整はスタートしているとはみています。

しかし、揉んでから落ちるのがメインシナリオです。

上限を後0-2度試した後、111円台LOWまで下落して底堅さを確認する局面だとみています。

We used hourly data and the Oceania time zone market price is pulled out.

This is trend line.

Collection seems to start.

But steadiness will continue for some time.

The price will challenge upside limit for zero to two times and will challenge 111yen low.

chart2


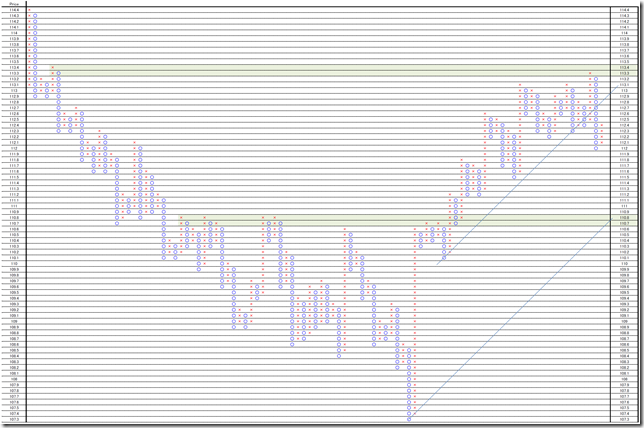
1枠0.1円、3枠転換の終値ポイントアンドフィギュアです。

1時間足を使用しオセアニア時間帯を省いています。

45度線を割ったため、調整は始まったようにみえます。

113.30-40円がレジスタンス、110円HIGHがサポートです。

This is 0.1 price change and 3 box reversal close price’s Point and Figure chart.

We used hourly data and the Oceania time zone market price is pulled out.

The price cut 45 degree support and collection seems to start.

The resistance is 113.30-40yen and the support is 110yen high.

PF


相場分析のリクエストがありましたら“Contact Us”からお知らせください。ご要望にお応えできるように努力いたします。

このブログはあくまでも個人的な見解であり、投資判断は各自でお願い致します。当ブログは一切の投資損益に対する責任を負いません。

ホームページに来て下さってありがとうございます。明日もよろしくお願いいたします。

If you have some request to analyze, please write to “Contact Us”.

We do best effort for your request.

These are only personal opinions on this blog, and you need the investment judgment in each one. This blog doesn’t assume the responsibility to all the investment profit and loss.

Thank for watching our contents. My best regards next day.

如果您需要行情分析,请点击“Contact Us”联系我们。我们将尽力满足您的要求。

本博客仅为个人意见,请各自做出投资判断。本博客概不对任何投资盈亏负责。

感谢您访问本博客。欢迎再次使用。


日経平均週足・羽黒12(13)号線と羽黒2号線コンビ・上値余地は乏しそう、むしろ売り場探しの局面/NIKKEI 225 weekly; the combination of “HAGURO” No. 12(13) and No.2; rally will end sooner and now seems to be selling chance. /日经225。羽黑12(13)号线和羽黑2号线的组合。反弹将结束更快。相反,现在我们等待似乎是卖的机会。

2017/10/07

日経平均週足・羽黒12(13)号線と羽黒2号線コンビ・上値余地は乏しそう、むしろ売り場探しの局面

NIKKEI 225 weekly; the combination of “HAGURO” No. 12(13) and No.2; rally will end sooner and now seems to be selling chance.

日经225。羽黑12(13)号线和羽黑2号线的组合。反弹将结束更快。相反,现在我们等待似乎是卖的机会。


本日は日経225についてです。

結論は上がったら売りたい局面。

Today is about N225 Weekly.

Our conclusion is sell on high will work well.


「日経平均・過去をなぞるなら20000円超の値もちはどんなに長くても今年10月末まで?・20200円を超えたらとりあえずLong」(2017/6/8)

2017/6/20には、「本日は20200円の終値を超えてきましたが、週末まで20200円をKeepできるか注目です。週足終値で20200円超をキープできると、Rally startとみています。」と報告しています。

「日経平均週足・羽黒6号線・上へ下へと大暴れの荒っぽい相場継続示唆」(2017/9/23)

We reported “N225 historically; keeping 20000yen over may be end of October at longest; 20200yen over will be buying opportunity” in 6/8/2017.

We reported “Today, the market price went 20200yen over in close price and keeping 20200yen over in weekend close will start a new rally” in 6/20/2017

We reported “NIKKEI 225 weekly is “HAGURO” No.6 formation; Rampaging?; Volatility will get higher” in 9/23/2017.


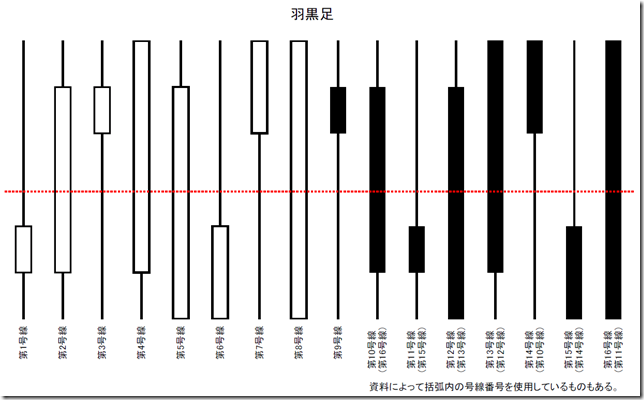
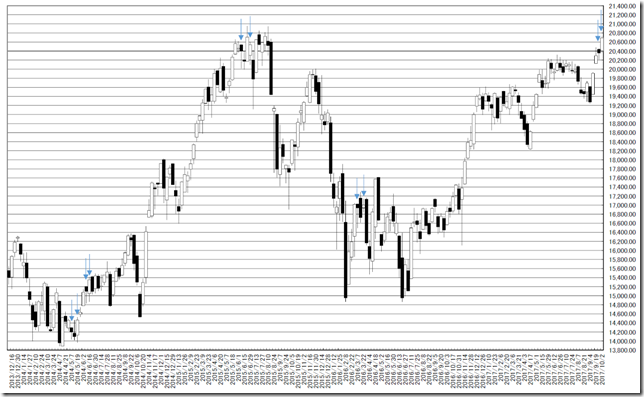
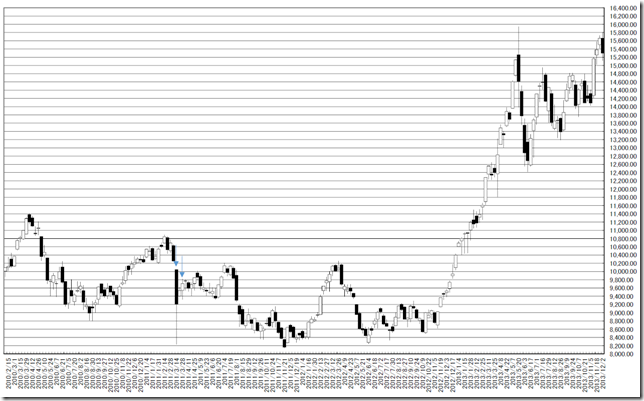
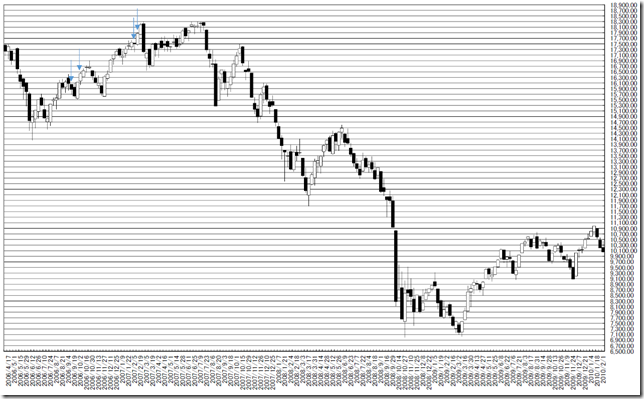
日経225週足線は羽黒2号線となりました。

日経225週足線では600週で羽黒2号線は100回出現しています。

単体では意味のない線です。

先週の羽黒12(13)線と組み合わせると、意味が出ます。

羽黒12(13)号線と羽黒2号線コンビでは、リバーサルを示唆していたようです。

急騰よりも急落に注意です。

In this week, N225 formed “HAGURO” No.2 formation.

In past 600 weeks, N225 price formed “HAGURO” No.2 formation was 100 time.

We cannot judge from single formation.

Combining No. 12(13) and No.2, there are some meaning.

These combination implied reversal.

We need to take care of falling rather than jumping

haguro

chart1chart2chart3


相場分析のリクエストがありましたら“Contact Us”からお知らせください。ご要望にお応えできるように努力いたします。

このブログはあくまでも個人的な見解であり、投資判断は各自でお願い致します。当ブログは一切の投資損益に対する責任を負いません。

ホームページに来て下さってありがとうございます。明日もよろしくお願いいたします。

If you have some request to analyze, please write to “Contact Us”.

We do best effort for your request.

These are only personal opinions on this blog, and you need the investment judgment in each one. This blog doesn’t assume the responsibility to all the investment profit and loss.

Thank for watching our contents. My best regards next day.

如果您需要行情分析,请点击“Contact Us”联系我们。我们将尽力满足您的要求。

本博客仅为个人意见,请各自做出投资判断。本博客概不对任何投资盈亏负责。

感谢您访问本博客。欢迎再次使用。

© 2025 Retar