2017/12

ドル円1時間足・売りたい・113円evenは近くて遠いレジスタンスになるかも??

2017/12/04

ドル円1時間足・売りたい・113円evenは近くて遠いレジスタンスになるかも??

USDJPY hourly; We want to sell; 113yen even is close but may work as strong resistance.

美元/日元。我们想卖。113日元即使接近,但可能作为强大的阻力。


「ドル円1時間足・111円even付近のサポートは抜けないなら、今週は買いから入りたい」(2017/11/27)

先週は最後の「ドッカーン」をのぞき、買いから入った方が有利でした。

今週は“Sell on high”で臨みたい局面であり、113円台で売りが入れられればBestだとみています。

We reported “USDJPY hourly; 111yen even will work as support and buying will be profitable” in 11/27/2017.

In last week, buying was profitable except “the last big fall”.

In this week, “Sell on high” will work well and selling at 113yen around will be great deal.


1時間足を使用しオセアニア時間帯を省いています。

週末ぐらいしか窓の空かない相場ですが、薄い時間であるオセアニア時間を抜くと窓が示現します。

そして、窓はいずれ埋まります。

また、1500-2000営業時間を超える窓をキャンセルするルールにすると、ほぼすべての窓が埋まります。

私たちは2000時間足ルールを採用しています。

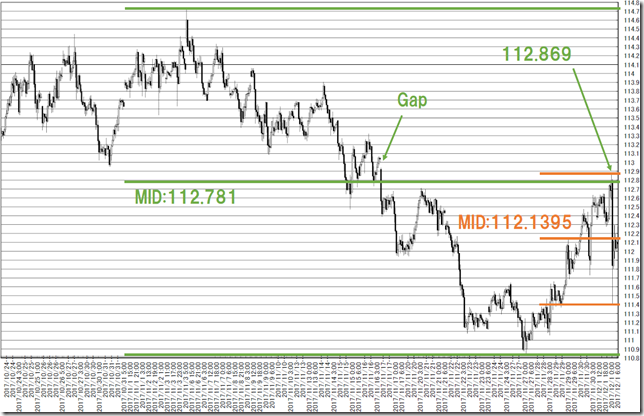
残る窓は、113円even付近と108円lowに位置しています。

We used hourly data and the Oceania time zone market price is pulled out.

FX market only remains gaps at week end but omitting the Oceania time zone market price, there remains many gaps.

And gap will bury in future.

There is additional rule; when the gap does not bury from 1500 to 2000 hours over, we cancel them but almost all gaps are buried before then.

We adopt 2000 hours rule.

There remains two gaps; 113yen even around and 108yen low.

chart1_conv


1時間足を使用しオセアニア時間帯を省いています。

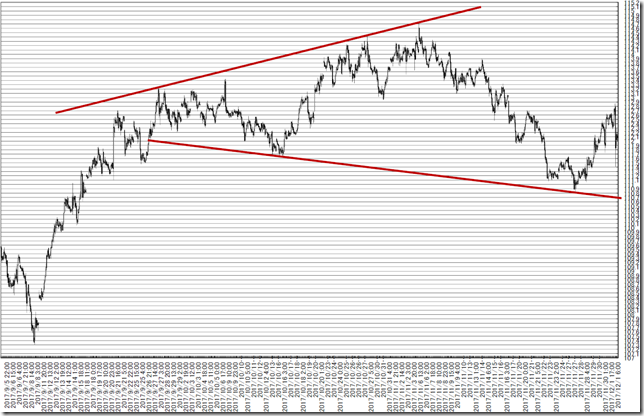
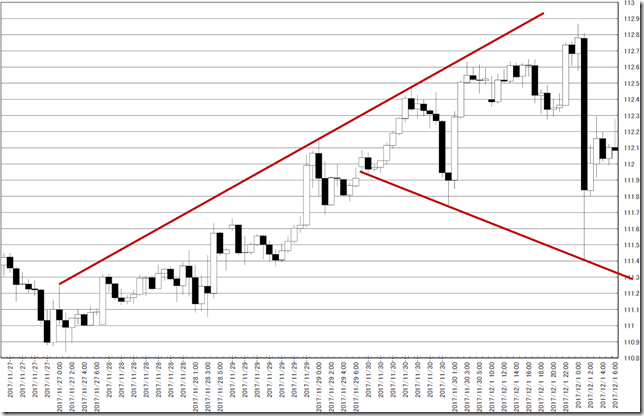
重要な状況の確認としてヤラレヤ安い拡大波動です。

実体抜き後の戻しが、狙いやすい場所になるとみています。

We used hourly data and the Oceania time zone market price is pulled out.

This market is “Y” wave formation and now is difficult condition.

Cutting with candle stick body and recovery point will be good entry point.

chart2_convchart3_conv


1時間足を使用しオセアニア時間帯を省いています。

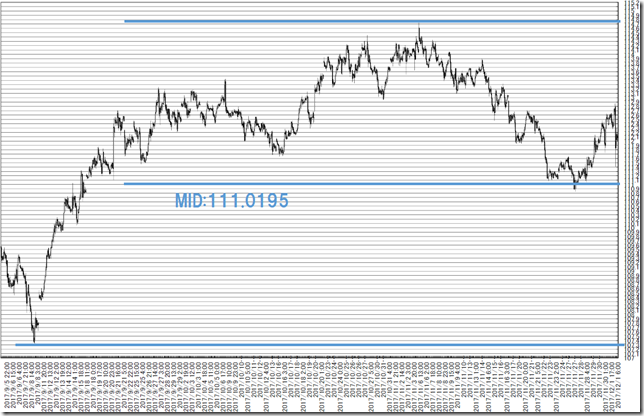
半値関係のチャートです。

「半値押しは全値押し」は、強力なテクニックです。

111円を割っているため、基本的には下だろうとは思います。

113円の窓を埋めた後、「やっぱり上はダメ~」となって、落っこちていくのが乗っていきやすいシナリオです。

しかしながら、113円というのは、半値の少し上にある近くて遠い窓である点も確かな事実です。

しばらく埋まらない可能性もあります。

We used hourly data and the Oceania time zone market price is pulled out.

These charts suggest the half price relation.

“When price reached the half price, price often recovers all”, this is Japanese saying

The price cut the half price in major chart and this seems to be bear market.

And burying 113 yen gap and fall will be great opportunity.

But 113 yen exists “the half price” over and this zone is still far and this zone may not bury for some time.

chart4_convchart5_conv


1時間足を使用しオセアニア時間帯を省いています。

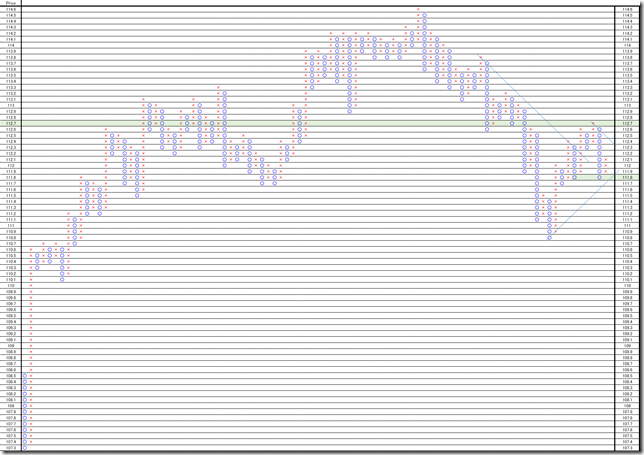
P&Fでは、45度線を割れていないため、もう一度上値試しがあっても良いとみています。

This is 0.1 price change and 3 box reversal close price’s Point and Figure chart.

The price does not cut 45 degree support and there is still bull condition.

PF_conv


相場分析のリクエストがありましたら“Contact Us”からお知らせください。ご要望にお応えできるように努力いたします。

このブログはあくまでも個人的な見解であり、投資判断は各自でお願い致します。当ブログは一切の投資損益に対する責任を負いません。

ホームページに来て下さってありがとうございます。明日もよろしくお願いいたします。

If you have some request to analyze, please write to “Contact Us”.

We do best effort for your request.

These are only personal opinions on this blog, and you need the investment judgment in each one. This blog doesn’t assume the responsibility to all the investment profit and loss.

Thank for watching our contents. My best regards next day.

如果您需要行情分析,请点击“Contact Us”联系我们。我们将尽力满足您的要求。

本博客仅为个人意见,请各自做出投资判断。本博客概不对任何投资盈亏负责。

感谢您访问本博客。欢迎再次使用。


日経平均年末終値想定・「掉尾の一振」ならば24000円超もあり、2015年に倣うなら21800円?

2017/12/03

日経平均年末終値想定・「掉尾の一振」ならば24000円超もあり、2015年に倣うなら21800円?

Estimation of N225 yearly close; rally may reach 24000yen over or the price may fall 21800yen like 2015?

日经225年末收盘价的预估。反弹可能在达到24000日元或价格可能下跌21800日元像2015年?


日経新聞・2017/12/1付朝刊21面

「師走相場、株先高観強く・証券・運用会社 好調な企業業績が支え・来年は25000円予想多く」

本レポートの年末までに想定となる24000円付近までの到達となると、多くが予想する25000円までのノリ代はあと少し。

「日経平均波動計算・1989年バブルをなぞるなら、大天井は27000円以下??」(2017/11/11)とも報告しています。

Nikkei Newspaper in 12/1/2017 morning edition reports “

“Stock company says December market will be great rally; it based on well running on corporate performance; most says the price will reach 25000yen over in next year.”

If the price will reach 24000yen around at the end of this year, there is only 1000 yen to reach 25000yen.

We also reported “NIKKEI 225 wave calculation; following the price movement in 1989, major peak will be lower than 27000yen” in 11/11/2017.


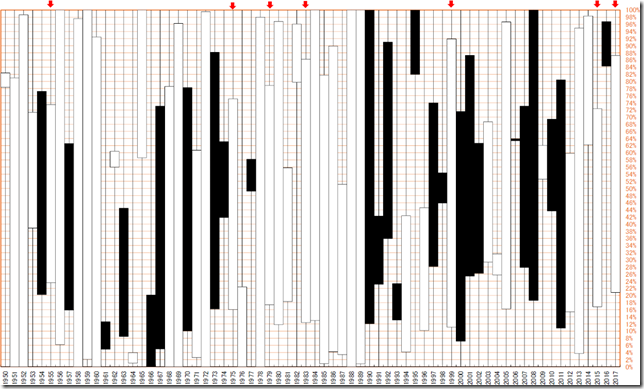
1950年から2017年の1月から11月までのろうそく足を並べてみました。

上ヒゲ、下ヒゲ共に残した1955年、1975年、1979年、1983年、1999年、2015年などが2017年と似ています。

11月クローズからの12月クローズまでの上昇率は、それぞれ108%、101%、102%、106%、102%、96%でした。

直近の2015年だけアンダーパフォームしただけで基本的には「掉尾の一振」の期待がもてます。

We use from January to November data from 1950 to 2017 and form candle sticks.

2017 figure is similar to 1955, 1975, 1979, 1983, 1999 and 2015.

Each of rate of increase is 108%, 101%, 102%, 106%, 102% and 96%.

Almost all cases were rally except 2015 case.

chart1_conv


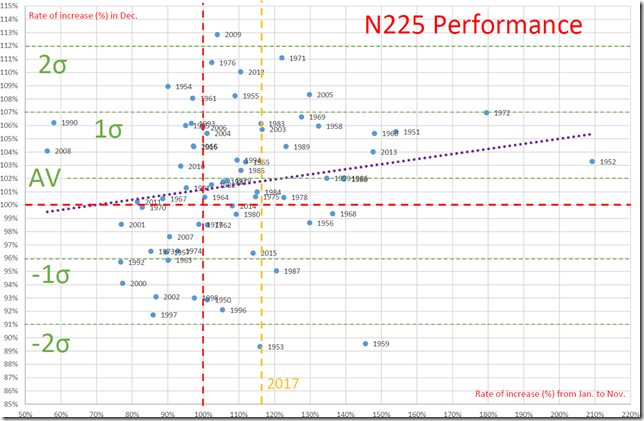
1950年から2016年の1月オープンから11月クローズまでの上昇率を横軸、1950年から2016年の11月クローズから12月クローズまでの上昇率を縦軸としました。

標準回帰線が右肩あがりとなっており、モメンタムの維持、つまり「掉尾の一振」が追認できます。

2017年の1月オープンから11月クローズまでの上昇率は117%。

過去の平均的なパフォーマンスが適応されると23070 円(22724.96 * 102%)。

2015年相当のパフォーマンスとなるなら、21863円(22724.96 * 96%)。

過去の実績の1σとなる「掉尾の一振」を適用すると24280円(22724.96 * 107%)となり、実績的には納得です。

あおりたい訳でではありませんが、2σは24476円、-2σは20655円なので、過去の実績に照らせば「2万円は切らんよな、ぶっ飛びで2万5千円もありかな」となります。

一方、今のところ「20000円は底堅い」とも言えます。

Horizontal is the performance from Jan. to Nov. (1950 – 2016) and vertical is the performance from Nov. to Dec.

Approximate curve is growing and we can know “Dec. performance was good!”

From Jan. to Nov. in 2017, rate of increase was 117%.

Applying the past average performance, the price will reach 23070yen (22724.96 * 102%) until December close.

And 1 sigma performance is 24280yen (22724.96 * 107%) and lower than this price will be reasonable.

Applying 2015 performance, the price will fall 21863yen (22724.96 * 96%).

2 sigma is 24476yen and -2 sigma is 20655yen.

On the other hand, 20000yen around will work as stable support.

chart2_conv


相場分析のリクエストがありましたら“Contact Us”からお知らせください。ご要望にお応えできるように努力いたします。

このブログはあくまでも個人的な見解であり、投資判断は各自でお願い致します。当ブログは一切の投資損益に対する責任を負いません。

ホームページに来て下さってありがとうございます。明日もよろしくお願いいたします。

If you have some request to analyze, please write to “Contact Us”.

We do best effort for your request.

These are only personal opinions on this blog, and you need the investment judgment in each one. This blog doesn’t assume the responsibility to all the investment profit and loss.

Thank for watching our contents. My best regards next day.

如果您需要行情分析,请点击“Contact Us”联系我们。我们将尽力满足您的要求。

本博客仅为个人意见,请各自做出投资判断。本博客概不对任何投资盈亏负责。

感谢您访问本博客。欢迎再次使用。

© 2025 Retar