2017/12

東京円建て金日足ザラバ・1980年の日柄をなぞるなら、2018/2/1は興味深い変化時間

2017/12/13

東京円建て金日足ザラバ・1980年の日柄をなぞるなら、2018/2/1は興味深い変化時間

Tokyo market gold daily continuous session; following 1980’s price movement, 2/1/2018 will be notable “HENKABI”.

东京市场的黄金。如果现在的价和1980年的价格一样的话, 就“变化日”是2018年2月1日。


本日は1980年代の高値と最近の高値からの日柄を比較しました。

結論は2018/2/1の変化日に注目したいと思います。

ここから下げるのか、上げるのかが運命の分かれ道かもしれません。

We compared 1980’s price movement and the latest market price movement.

Our conclusion is 2/1/2018 will be notable “HENKABI”.

From that point, a new trend seems to start and this will be major trend..


ザラバデータで検証しています。

貴金属商の店頭で購入する価格です。

Retar.jpでは、普段は東京先物の値段を使っていますが、今後は店頭価格での説明を増やしていきたいと思います。

ザラバの金とは、田中貴金属、徳力本店、石福金属興業などの24金地金の1グラム当たりの店頭価格です。

大きな値動きが無ければ、1日1回に決まる建値です。

We use continuous session data.

This is goldsmith selling price.

Usually, we use future market price and we will use shop price because there exists possibility of necessity.

Continuous session means shop price of 1 gram pure gold.

This price defines once a day unless a big price move.


東京円建て金日足ザラバ・2018年2月中旬を超えて5000円超えならば新世界? (2017/11/29)

We reported “Tokyo market gold daily continuous session; if the price will keep 5000yen over after mid Feb. 2018, this will be a start of new world?” in 11/29/2017.


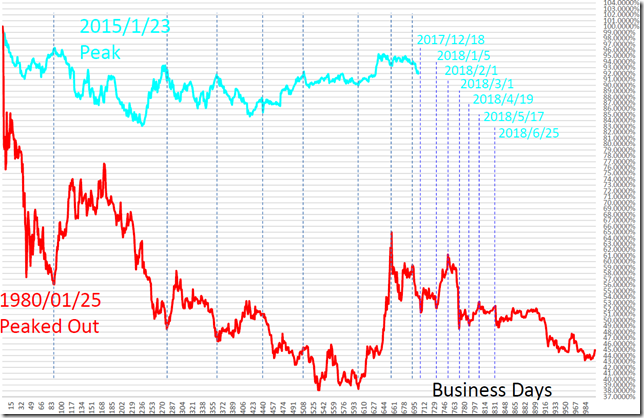
金は1980/1/21に6495円、2015/1/23に5383円をつけています。

それぞれの高値を100%としてチャートを書いてみました。

本日で高値からの702営業日です。

変化した時間帯に縦線を入れると、ほぼ似たような時間帯だったことがわかります。

今後も似たような日柄をなぞると仮定すると、2017/12/18、2018/1/5、2018/2/1、2018/3/1、2018/4/19、2018/5/17、2018/6/25などが変化日として想定できます。

また、1月の20日前後も興味深い時間帯だともみています。

Gold took the highest in 1/21/1980 and 1/23/2015. (6595yen and 5383yen)

We treat each highest as 100% and draw chart.

Today is 702 business days from the highest.

We can know “HENKABI” are similar.

Following this “HIGARA”, 12/18/2017, 1/5/2018, 2/1/2018, 3/1/2018, 4/19/2018, 5/17/2018 will also be “HENKABI”.

chart1_conv


相場分析のリクエストがありましたら“Contact Us”からお知らせください。ご要望にお応えできるように努力いたします。

このブログはあくまでも個人的な見解であり、投資判断は各自でお願い致します。当ブログは一切の投資損益に対する責任を負いません。

ホームページに来て下さってありがとうございます。明日もよろしくお願いいたします。

If you have some request to analyze, please write to “Contact Us”.

We do best effort for your request.

These are only personal opinions on this blog, and you need the investment judgment in each one. This blog doesn’t assume the responsibility to all the investment profit and loss.

Thank for watching our contents. My best regards next day.

如果您需要行情分析,请点击“Contact Us”联系我们。我们将尽力满足您的要求。

本博客仅为个人意见,请各自做出投资判断。本博客概不对任何投资盈亏负责。

感谢您访问本博客。欢迎再次使用。


NY金週足・サポートは1200ポイント・むしろ下がってくれてサンキュでは?

2017/12/12

NY金週足・サポートは1200ポイント・むしろ下がってくれてサンキュでは?

NY GOLD weekly; Support is 1200 point around; rather than, now seems to be buying opportunity?

纽约黄金。支持是1200点左右。而现在似乎是买入机会,是不是?


結論は「夜明け前は一番暗い」。

中長期で見た時、株ならば半値というのは当たり前。

金というのはボラティリティの低さが魅力です。

Our conclusion is “It’s darkest before a dawn”.


「NY金日足・1260ポイント付近は引き続き買い場・思い出そう執務室もキンキラ金だった」(2017/10/31)

日足ベースでは誤りだったと思います。

We reported “NY GOLD daily; 1260 point is still buying opportunity” in 10/31/2017.

In daily chart, we are wrong.


「NY金月足・波動計算・本物の地政学リスクなら1450ポイントを軽々超えるはず」(2017/9/5)

「既に景色が変わっているとみています。」(2017/1/31レポート)

「息の長い相場は始まっているとみているため、押しは買い向かいたいと思います。」(2017/2/27報告)

We reported “NY GOLD monthly; Wave calculation; A true geopolitical risks will be reveal, 1450 point will be weak resistance” in 9/5/2017.

We reported “We think this market trend seems to have already changed” in 1/31/2017.

And we also reported “We are bullish and dip will be a great opportunity” in 2/27/2017.


1260ポイントとは、”金”好きを公言するトランプが大統領として決まった日のクローズの値です。(https://twitter.com/retar_jp/status/913038373413044224)

執務室もキンキラ金。(http://www.asahi.com/articles/ASK1Q4QN8K1QUHBI00W.html)

1260point is the close price of Trump became the president. (https://twitter.com/retar_jp/status/913038373413044224)

His office is gold colored. (http://www.asahi.com/articles/ASK1Q4QN8K1QUHBI00W.html)

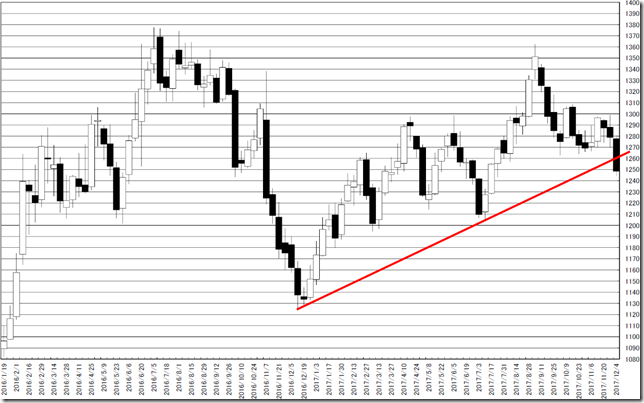
トレンドライン引いてみました。

「あちゃー、ハラミからの抜けじゃーん」ですが、慎重ながら強気で臨みたい局面です。

We draw trend line on the chart.

The price cut“Engulfing bar” and this often become bearish but this seems to be chance.

chart1_conv


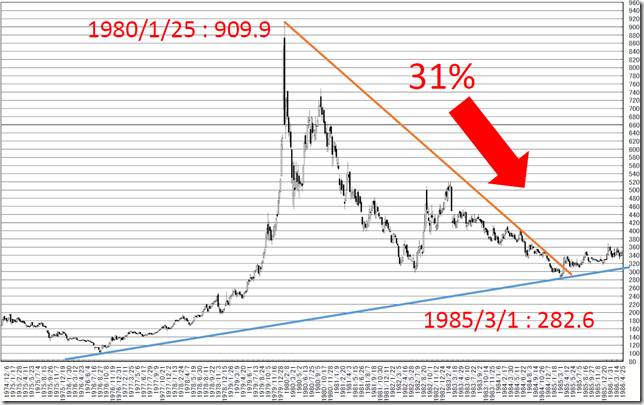
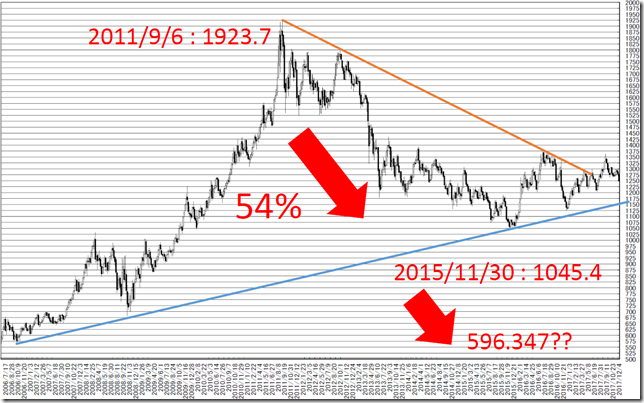
1980年ピークからの下げと2011年ピークからの下げを比較してみました。

今回の下げは半値になっておらず、1980年の場合は「半値八掛け二割引」超えです。

1980年代をなぞるなら、今頃600ドル付近までの下落もあったはずです。

2017/2/27の報告とあわせ下がったら買い向かいたい局面だとみています。

トレンドライン的には青までは下げる可能性を秘めています。

青を切ったら考えをかえます。

We compare the 1980 and 2017 falling phase.

In the latest market, the price cannot reach the half price and in 1980, the price reached 31%.

If the latest market follow the latest market price movement, the price may reach 600 dollar around but it did not so.

We pointed out “Buy on dip” will be great opportunity in 2/27/2017.

From trend line view, the price may reach blue line.

If the price will cut the blue line, we will change our mind.

1980_conv2017_conv


相場分析のリクエストがありましたら“Contact Us”からお知らせください。ご要望にお応えできるように努力いたします。

このブログはあくまでも個人的な見解であり、投資判断は各自でお願い致します。当ブログは一切の投資損益に対する責任を負いません。

ホームページに来て下さってありがとうございます。明日もよろしくお願いいたします。

If you have some request to analyze, please write to “Contact Us”.

We do best effort for your request.

These are only personal opinions on this blog, and you need the investment judgment in each one. This blog doesn’t assume the responsibility to all the investment profit and loss.

Thank for watching our contents. My best regards next day.

如果您需要行情分析,请点击“Contact Us”联系我们。我们将尽力满足您的要求。

本博客仅为个人意见,请各自做出投资判断。本博客概不对任何投资盈亏负责。

感谢您访问本博客。欢迎再次使用。

© 2025 Retar