2018/03

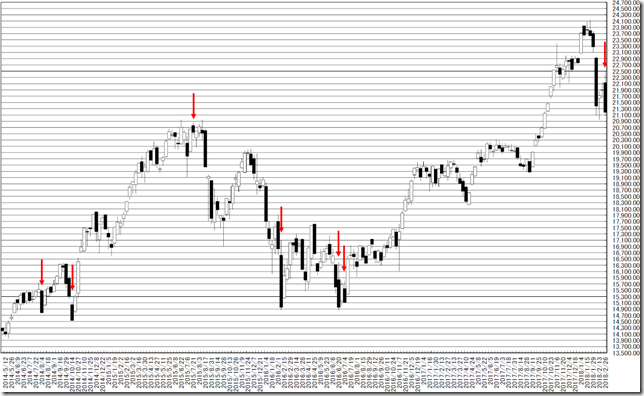
日経平均週足・羽黒13(12)号線・普通なら売り方をやめ買い場探し、来週も大きく下げるようならベアマーケット入り

2018/03/03

日経平均週足・羽黒13(12)号線・普通なら売り方をやめ買い場探し、来週も大きく下げるようならベアマーケット入り

NIKKEI 225 week; “HAGURO” No.13(12) formation; in normal condition, we can to buy but if the price will get lower this market gets into bearish.

日经225。羽黑13(12)号线。如果在正常情况下,我们可以买。如果价格会走低,这个市场会变得看跌。


結論は、基本的な見方は「下げても尻尾」の買い場探し、しかし、この先もドカドカ下げるようならベアマーケット入り。

本物のベアマーケット入りならば、もっと、弱気ブラザーズが示現するはずなので、

Our conclusion is our basically view is now is close to bottom but if the price will go much lower in next week, this will be a signal of getting into bear market.


「日経平均週足・羽黒13(12)号線・連発13(12)号線は、いよいよ「買い近し」のシグナル」(2016/7/9)

「日経平均週足・羽黒13(12)号線・底入れは近い」(2016/06/24)

「日経平均週足・羽黒13(12)号線・油断は禁物ですが、ようやく下げ止まりか」(2016/2/13)

We reported “NIKKEI 225 week; “HAGURO” No.13(12) formation; lining No. 13(12) often implied became the buying signal” in 7/9/2017.

We reported “NIKKEI 225 week; “HAGURO” No.13(12) formation; Bottom will be sooner” in 06/24/2016.

We reported “NIKKEI 225 weekly is “HAGURO” No.13(12) formation; take care and falling may stop” in 02/13/2016.


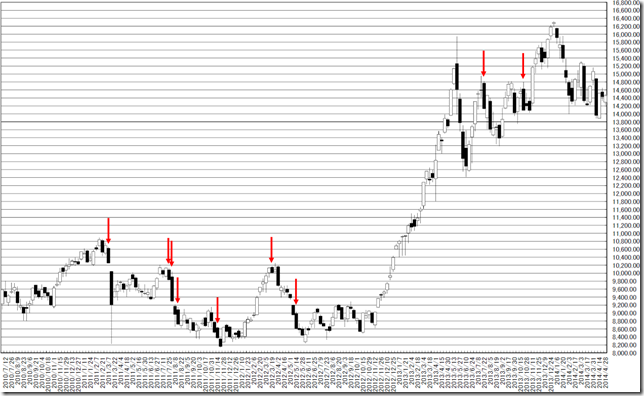
日経225週足線は羽黒13(12)号線となりました。

日経225週足線では600週で羽黒13号線は26回出現しています。

普通ならば、「下げても尻尾」となる下げ止まりの型です。

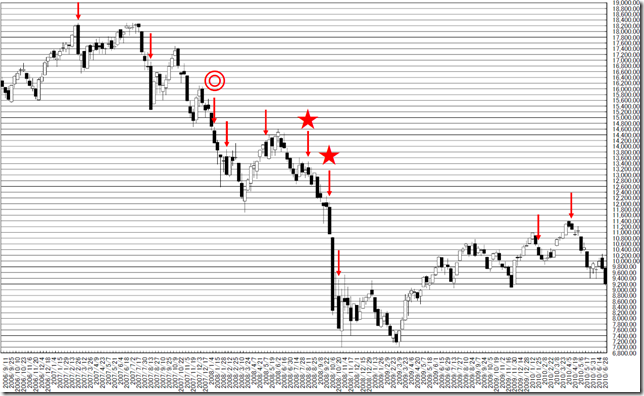
しかし、高値圏で示現したため、ドカドカと下方向へ抜けていくようならば、ベアマーケット入りを覚悟しなくてはいけない局面です。(星、二重丸地点)

例えば二重丸の地点などでは、典型的なベアマーケットの暗示となりました。

In this week, N225 formed “HAGURO” No. 13(12) formation.

In past 600 weeks, N225 price formed “HAGURO” No. 13(12) formation was 26 times.

This pattern often became typical reversal signal.

But this formation appeared in higher price zone and if the price will go lower after the next week, this will provide getting into bear market. (Star and double circles)

For example, at double circled point, this occasion was typical bear market signal.

chart1_convchart2_convchart3_conv


相場分析のリクエストがありましたら“Contact Us”からお知らせください。ご要望にお応えできるように努力いたします。

このブログはあくまでも個人的な見解であり、投資判断は各自でお願い致します。当ブログは一切の投資損益に対する責任を負いません。

ホームページに来て下さってありがとうございます。明日もよろしくお願いいたします。

If you have some request to analyze, please write to “Contact Us”.

We do best effort for your request.

These are only personal opinions on this blog, and you need the investment judgment in each one. This blog doesn’t assume the responsibility to all the investment profit and loss.

Thank for watching our contents. My best regards next day.

如果您需要行情分析,请点击“Contact Us”联系我们。我们将尽力满足您的要求。

本博客仅为个人意见,请各自做出投资判断。本博客概不对任何投资盈亏负责。

感谢您访问本博客。欢迎再次使用。


ドル円中長期・狙うは110-109円台からの売り・111円台に乗せたら見通し変更

2018/03/02

ドル円中長期・狙うは110-109円台からの売り・111円台に乗せたら見通し変更

USDJPY mid-to-long term; selling from 110yen around to 109 yen around will be great opportunity. Going 111yen over, we will change our mind.

美元/日元。从110日元左右到109日元左右的卖将是很好的机会。如果111日元以上了,就我们会改变主意。


本日はドル円中長期についてです。

結論は110-109円台から売りに入りたい。111円台に乗せるようなら考え方をすべて変更。

時間はタップリあるので、来るべきチャンスに向け検討しておけば良いと思っています。

本日は、「考え方が間違っていると認めるトリガー」は何かを考えておきたいと思います。

Today, we analyze USDJPY mid-to-long term.

Our conclusion is we want to sell from 110yen to 109yen around.

Going 111yen over, we will change out mind.

There remains much time for sell and we can prepare for opportunity.

Today, we survey the trigger for changing our mind.


「ドル円月足・トレンドライン的には円高シグナル点灯」(2018/2/22)

「ドル円長期・P&F・今後再び120円台に乗せるのは超円高のあとかも」(2018/2/21)

「ドル円中長期・土曜の朝(週足クローズ)に100円割れならば、超円高シグナルの点灯」(2018/2/20)

「ドル円週足・中長期の円高開始・春までに素敵な売り場がやってくるはず」(2018/2/16)

We reported “USDJPY Monthly; Yen will be strong from trend line view” in 2/22/2018.

We reported “USDJPY long term P&F; Yen seems to be stronger and it will need long period for taking 120yen over again” in 2/21/2018.

We reported “USDJPY Mid-to-long term; if weekend close price will cut 100yen, Yen will get much stronger” in 2/20/2018.

We reported “USDJPY Weekly; Yen will get stronger in mid-to-long term; Great selling opportunity will come by spring” in 2/16/2018.


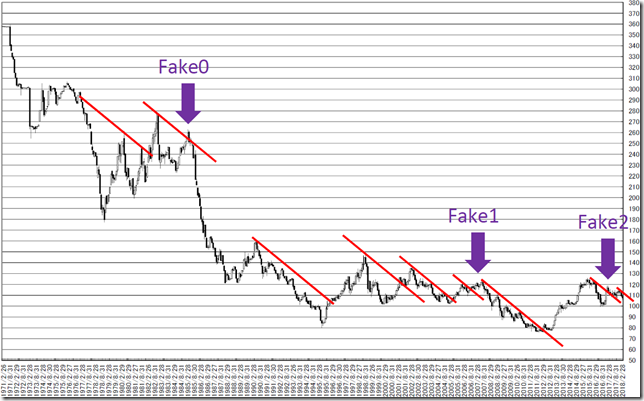
月足です。

為替の場合は、トレンドラインの引き方(https://www.retar.jp/?p=4509)で述べた「平行線」効果的だったことがわかっています。

チャート上の赤の線は歴史的トレンド転換線です。

価格が超えた場合、上昇トレンド入りは間違いなかった線です。

しかし、現在の状況では「Fake」の地点でダマシとなっています。

また、毎週のようにお知らせしている「窓」(2018/2/26参照)も、112円台に残しているため、埋まる可能性を秘めています。

過去にもダマシはあったのでメインシナリオは円高だとみていますが、考え方を変更するためのトリガーの準備が必要だと思っています。

This is monthly chart.

We know parallel trend line worked well on FX chart.

Red lines are most major historical lines.

Cutting it meant major trend change.

But in the latest case, it was fake.

And we need to remind gap exists 112yen around. (See 2/26/2018)

Our major view is Yen will get strong but we need to prepare for changing our mind.

chart1_conv


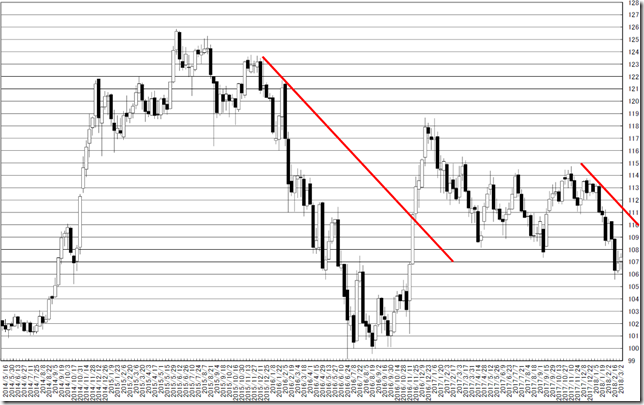
週足線です。

ここではトレンドラインの引き方)で述べた「妄想線」が役立ちます。

月足線と同じ角度で引き直してみると、現在は111円台にレジスタンスがありますが、タッチするころには切り下がってきます。

再び111円台に乗せるようなことがあれば、過去のレジスタンスが利かなかったことになり、全く新しい現象が示現している可能性があります。

This is weekly chart.

We draw “Estimate line” on the chart.

We can know the resistance exists 111yen around.

If the price will go 111yen over again, this will be a new type of occasion.

chart2_conv


相場分析のリクエストがありましたら“Contact Us”からお知らせください。ご要望にお応えできるように努力いたします。

このブログはあくまでも個人的な見解であり、投資判断は各自でお願い致します。当ブログは一切の投資損益に対する責任を負いません。

ホームページに来て下さってありがとうございます。明日もよろしくお願いいたします。

If you have some request to analyze, please write to “Contact Us”.

We do best effort for your request.

These are only personal opinions on this blog, and you need the investment judgment in each one. This blog doesn’t assume the responsibility to all the investment profit and loss.

Thank for watching our contents. My best regards next day.

如果您需要行情分析,请点击“Contact Us”联系我们。我们将尽力满足您的要求。

本博客仅为个人意见,请各自做出投资判断。本博客概不对任何投资盈亏负责。

感谢您访问本博客。欢迎再次使用。

© 2025 Retar