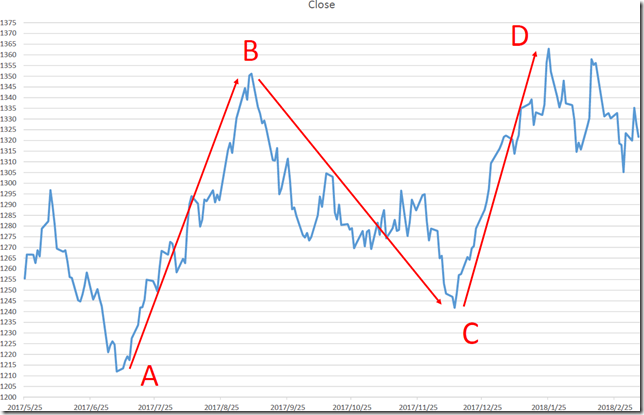
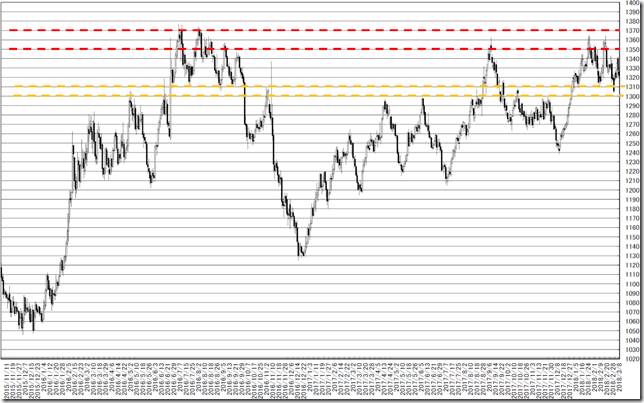
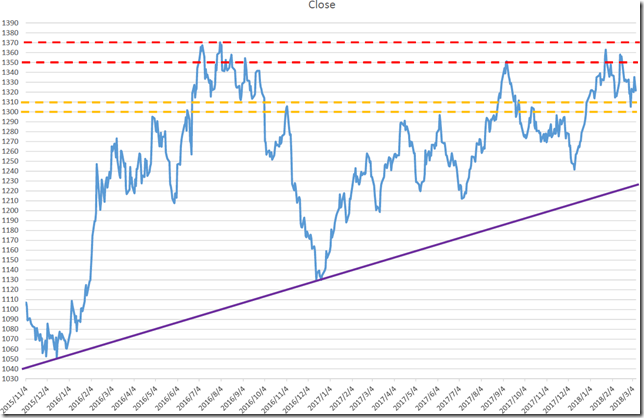
ドル円1時間足・買いから入りたいが新安値ならば撤退・引き続き107円台にレジスタンス色々
USDJPY hourly; we are bullish but taking new low, we will close; 107 yen around will work as resistance.
美元/日元。现在是牛市。但如果采取新的低价,我们会停止。仍然107日元左右将作为强大的抵抗。
今週の結論は、戻りだと思うが、107円台が重そう。
新安値をつけたら、シナリオクローズ。
今週上げると最近流行りの「夜明け前は一番暗い」パターン。
頭の片隅に入れておきたい「セリングクライマックス」のターゲットは102円台low。
In this week, this market seems to recover but 107yen around will work as resistance.
Taking new low, we will close long position.
If “Selling climax” will come true, the target will be 102yen low.
If rally will start in this week, this is the typical pattern of “It’s darkest before a dawn”.
「ドル円週足・中長期の円高開始・春までに素敵な売り場がやってくるはず」(2018/2/16)
中長期ではバリバリの円高派です。
しかし、過去の経験に照らすと、本物の素敵な売り場までは、もう少し時間がかかるとみています。
その時までは売りも買いもチマチマといきたいと思います。
We reported “USDJPY Weekly; Yen will get stronger in mid-to-long term; Great selling opportunity will come by spring” in 2/16/2018.
Yen will be get stronger but there need more time for perfect sell.
But before then, we will buy and sell in small price range.
先週は107円台に届かずに下落です。
いつも通りのチマチマ相場だとみています。
下方向に窓を残しているため、まずは埋まるとはみています。
しかし、簡単に埋まるのがメインシナリオですが、しばらくは戻り歩調で埋まらずに本当に円高になるときにドッカーンというパターンも想定が必要です。
むしろ、上方向は忘れ去られる窓になるとみています。
In last week the price cannot reach 107 yen around and fall.
This week also continue range market.
The price remained big gap at down side and this will gap will bury.
But our main scenario is this big gap will bury sooner but may not bury for some time.
This gap may bury the Yen strong market.
Rather than, upper side gap will forgot because of times up.
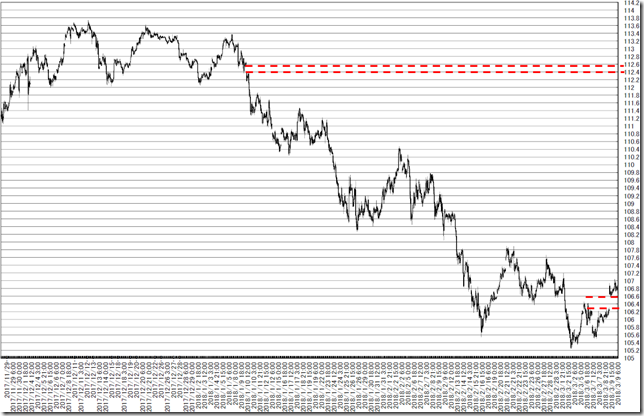
直近1500本の足です。
下方向に窓を追加したので、今週は106円台前半の買いがメインシナリオです。
上方向は112円台と遠い。
「2000時間ルール」から「3000時間ルール」に変更したくなっています。(2018/1/2参照)
These are latest 1500 candle sticks.
The price remained big gap lower side and this gap will bury sooner.
The gap exists 112yen around and this is far from now.
We want to change our rule from “2000hours” to “3000hours”. (See 1/2/2018 report)
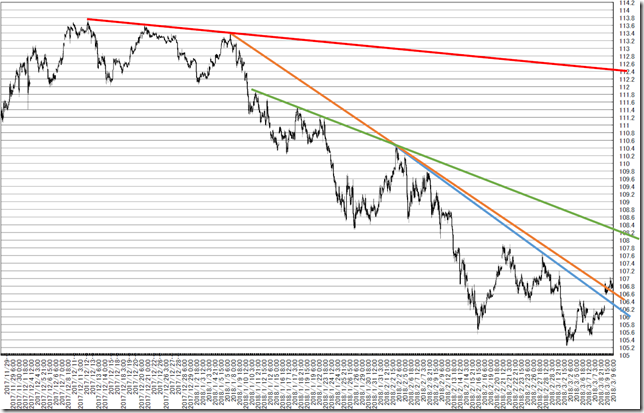
トレンドラインです。
メジャーレジスタンスを超えたので、買い先行です。(青、オレンジ)
緑までの戻りはありだとはみています。
This is trend line analysis.
The price cut the major resistance and we are bullish. (Orange and blue lines)
It will be natural recovering green line.
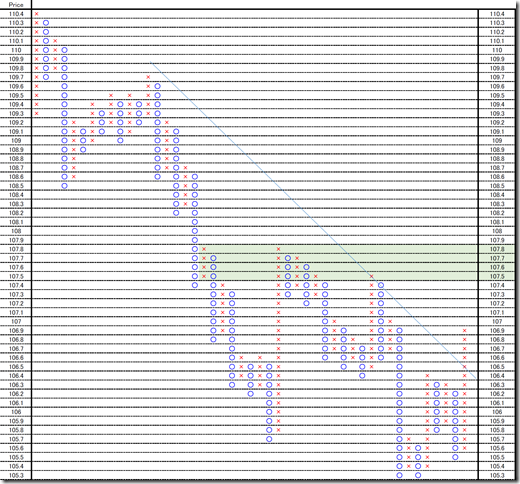
1時間足を使用しオセアニア時間帯を省いたP&Fです。
P&Fでも45度線を超えたため、底打ち感満点です。
107円台後半にレジスタンスが控えています。
This is 0.1 price change and 3 box reversal close price’s Point and Figure chart.
In P&F chart, the price cut 45 degree resistance line and this market seems to bottom out.
There is major resistance at 107 yen around.
相場分析のリクエストがありましたら“Contact Us”からお知らせください。ご要望にお応えできるように努力いたします。
このブログはあくまでも個人的な見解であり、投資判断は各自でお願い致します。当ブログは一切の投資損益に対する責任を負いません。
ホームページに来て下さってありがとうございます。明日もよろしくお願いいたします。
If you have some request to analyze, please write to “Contact Us”.
Wnext day.e do best effort for your request.
These are only personal opinions on this blog, and you need the investment judgment in each one. This blog doesn’t assume the responsibility to all the investment profit and loss.
Thank for watching our contents. My best regards next day.
如果您需要行情分析,请点击“Contact Us”联系我们。我们将尽力满足您的要求。
本博客仅为个人意见,请各自做出投资判断。本博客概不对任何投资盈亏负责。
感谢您访问本博客。欢迎再次使用。

