2018/04

ドル円週足・どこまで上がるかはともかく、経験的に107円ミドルより上は売り場

2018/04/25

ドル円週足・どこまで上がるかはともかく、経験的に107円ミドルより上は売り場

USDJPY weekly; we do not know major peak but higher than 107yen middle will be selling opportunity.

美元/日元。我们不知道主要高峰期,但高于107日元中间将是卖机会。


結論は上がってくれてありがとう。

107円ミドルから上は売り場。

Our conclusion is now is “Thank you rally”.

Higher than 107yen middle will be great selling opportunity.


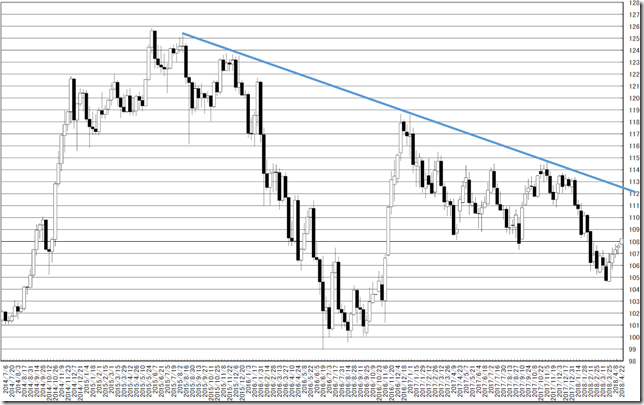
「ドル円中長期・トレンドライン・「110-109円台からの売り」を狙っていましたが、もうないかも?離れは6月中旬??」(2018/4/4)

このレポートでは以下のように述べています。

バリバリの円高派ですが、戻り天井がイメージできないでいます。

戻り高値が完了してしまった可能性を疑い始めています。

それでも相場は、109-110円程度までの戻りがあっても、納得の位置です。

中長期の視点からみれば、毎週報告している112円台の窓(2018/4/1)までの戻りはまずないというより、今年中に実現するなら「新機軸の相場」です。

イメージするなら、このまま102円程度への下げ6割、109-110円程度までの戻し4割、テールリスクとして112円までの戻しといった感覚です。

We reported “USDJPY mid-to-long term; we expected ” selling from 110yen around to 109 yen around” but it may not come true; down side breaking may start in mid-June?” in 4/4/2018.

We reported under these.

We are Yen longer but we cannot predict proper recovery high.

Now may have already taken major high.

If the price will recover 109-110yen around this occasion will be reasonable.

But recovering 112yen around seems to be difficult and is it will come true, we need to rebuild our mind.

We can provide 3 types of scenario; main is directly fall at 102yen around (60%) and secondary is recovering 109-110yen around and fall (40%) and third is recovery to 112yen. (Tail Risk)


111円まで戻してもダウンサイドトレンドは維持しており、売り場を提供してくれる素敵な上げだとみています。

104円から5-6円ぐらいの上げとなるため、Big Break前には御誂え向きです。

考えを訂正するのは、青い線を超えてからです。

でも、遠いですよ。

If the price will recover 111yen around, down side trend will continue and it will be great opportunity.

And this will mean 5-6yen jumping from 104yen and reasonable rally for big breaking.

We keep this mind until cutting blue line but it is very far!

chart1_conv


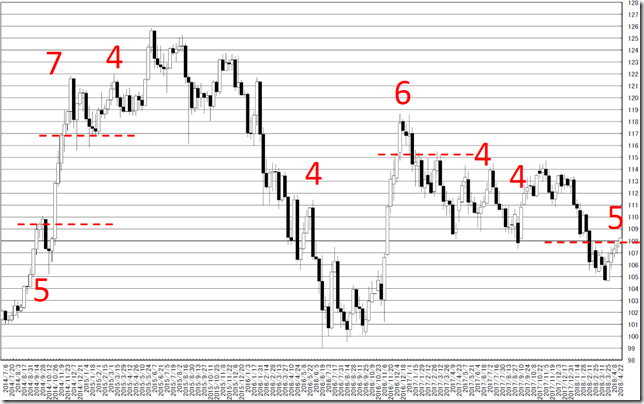
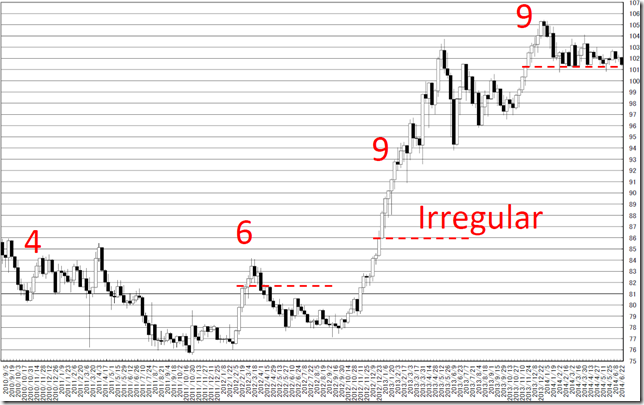
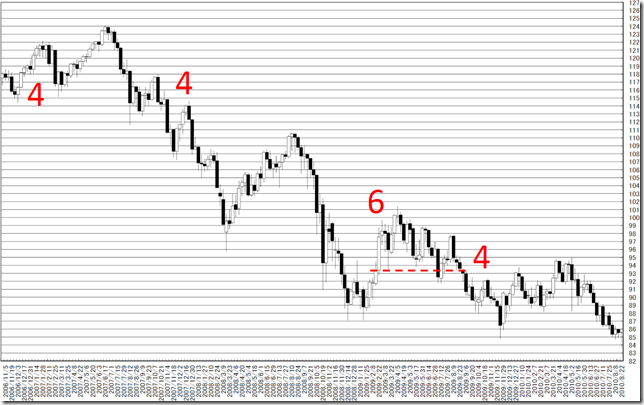
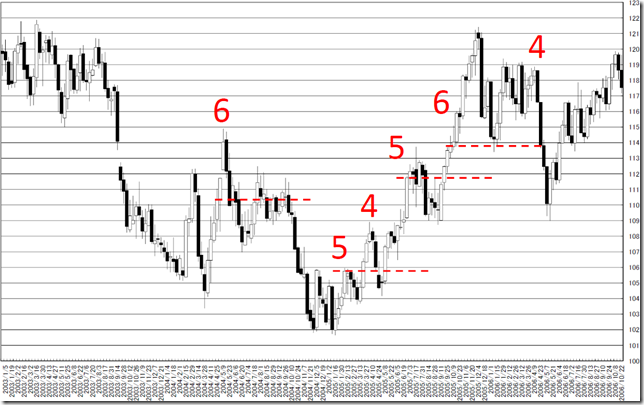
本日はドル円週足のろうそく足の性質について紹介します。

連続陰線4手以上のところに印をいれました。

4手を超えたところには、4手目の終値に横線を入れました。

必ず4手を超えた陽線では、4手目の終値に戻ってくる性質があります。

イレギュラーは1回。

現在の状況に当てはめると、107円ミドル程度まではいずれ戻ってくることが想定されます。

天井はわかりませんが、「ホイホイ上がれ、売ってやろう」という気になってきます。

Today, we introduce unique character of candle sticks.

We mark continuous white candle sticks in 4 times over.

And we draw horizontal line at 4 times close price.

We can know the price went back to around there.

Irregular pattern was only once.

Applying this fact to the latest market, the price will go back 107yen middle sooner.

We cannot estimate the major peak but we want to sell at higher zone.

chart2_convchart3_convchart4_convchart5_conv


相場分析のリクエストがありましたら“Contact Us”からお知らせください。ご要望にお応えできるように努力いたします。

このブログはあくまでも個人的な見解であり、投資判断は各自でお願い致します。当ブログは一切の投資損益に対する責任を負いません。

ホームページに来て下さってありがとうございます。明日もよろしくお願いいたします。

If you have some request to analyze, please write to “Contact Us”.

We do best effort for your request.

These are only personal opinions on this blog, and you need the investment judgment in each one. This blog doesn’t assume the responsibility to all the investment profit and loss.

Thank for watching our contents. My best regards next day.

如果您需要行情分析,请点击“Contact Us”联系我们。我们将尽力满足您的要求。

本博客仅为个人意见,请各自做出投资判断。本博客概不对任何投资盈亏负责。

感谢您访问本博客。欢迎再次使用。


日経平均日足・変化日は2018/4/24、2018/5/14、2018/5/29

2018/04/24

日経平均日足・変化日は2018/4/24、2018/5/14、2018/5/29

NIKKEI 225 daily; “HENKABI” are 4/24/2018, 5/14/2018 and 5/29/2018.

日经225。“变化日”是2018年4月24日,2018年5月14日和2018年5月29日。


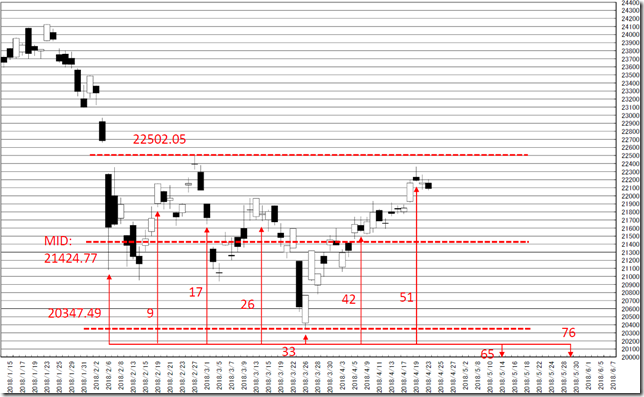
本日は日経225超短期日足についてです。

本日の結論は、変化日は2018/4/24、2018/5/14、2018/5/29。

集中日がないため持ち合いが基本。

ピークアウトした可能性が7割ぐらい、24900円までの上げが3割ぐらいの可能性をみています。

いずれにせよ、Rallyは22500円を実体抜きしてから。

Today is about N225 daily.

Our today’s conclusion is NIKKEI 225 daily; “HENKABI” are 4/24/2018, 5/14/2018 and 5/29/2018.

There are no special concentrated days.

Our main scenario is this market seems to be peaked out and the possibility is 70%.

Or will reach 24900yen around and the possibility is 30%.

Rally will start cutting 22500yen and we can only be bullish.


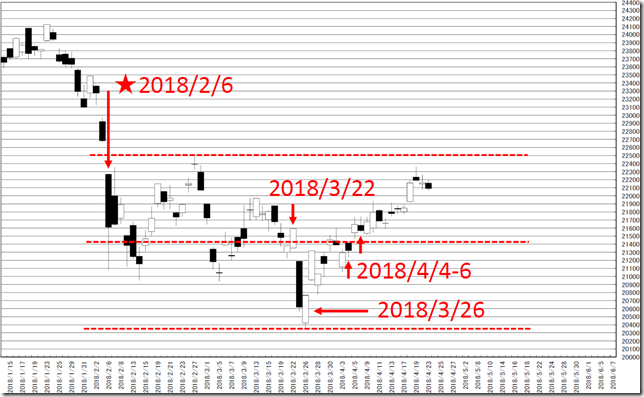
日柄のレポートは復習つきで解説していきます。

半値やピークを良い感じでとらえています。

「日経平均日足・変化日は2018/4/4-2018/4/6、2018/3/22-2018/3/26」(2018/3/13)

「日経平均日足・追補、変化日集中・2018/3/22、2018/3/26に要注意!!」(2018/3/22)

We review our past “HIGARA” report in any time.

Peaks and “Half price” were well captured.

We reported “NIKKEI 225 daily; “HENKABI” are 4/4/2018-4/6/2018 and 3/22/2018-3/26/2018; launching may occur visibly” in 3/13/2018.

We reported “NIKKEI 225 daily; Additional caution; “HENKABI” are 3/22/2018 and 3/26/2018” in 3/22/2018.

chart1_conv


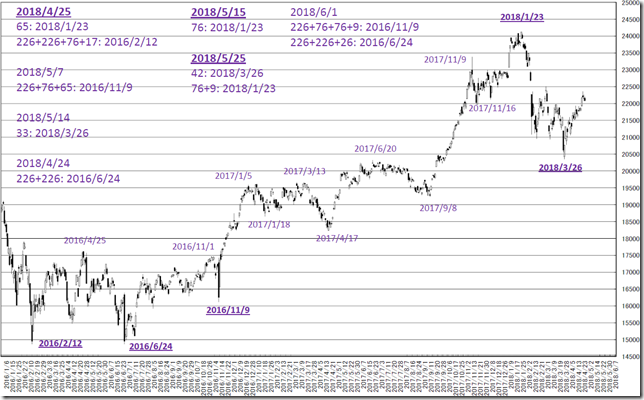
メジャーな頂点からの変化日の位置です。

今後の注目点は高値からの日柄です。

This is the “HENKABI” from the major peaks.

The notable “HENKABI” will be related to the latest highest.

chart2_conv


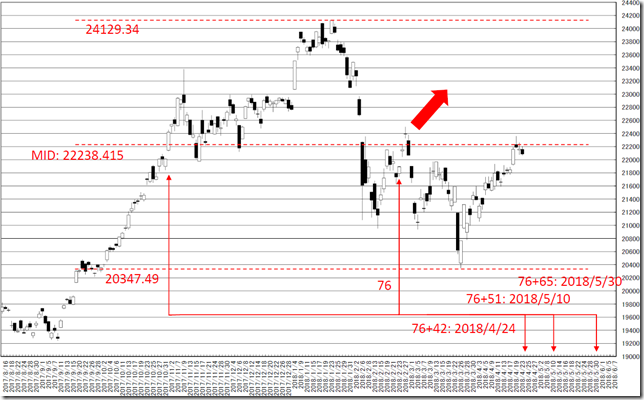
2017/11/1基点とした持ち合いです。

この持ち合いが解せません。

76手を超えてポシャッタのが、どうにも納得できないでいます。

This is steadiness from 11/1/2017.

We cannot agree to this “HIGARA”.

The price jumped 76 business days over but felled.

chart3_conv


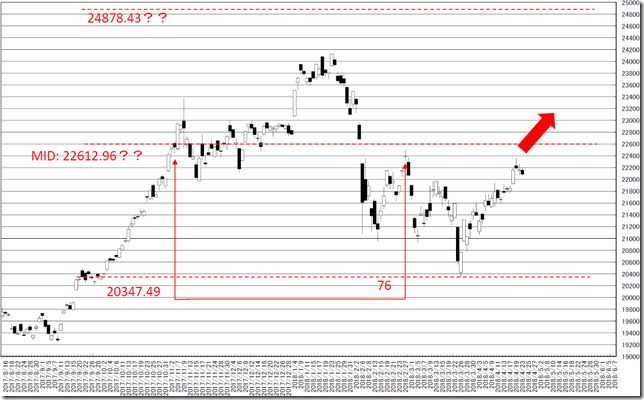
基点を2018/11/6として考えると納得できます。

この場合、上限は24878.43円となり新高値です。

妄想チャートですが、これなら納得の日柄です。

例えば「6月解散」とか??

When we move the basis to 11/6/2018, this is reasonable.

The upper side will be 24878.43yen and this is new high.

This is only delusion chart but this is agreeable.

For example, dissolution of the lower house of parliament will occur in June??

chart4_conv


2018/2/6基点とした持ち合いです。

一番ピークとかみ合っています。

離れの基点となりそうなので、注目しています。

This is steadiness from 2/6/2018.

This series are synchronized peaks and “Half price”.

And these are notable.

chart5_conv


相場分析のリクエストがありましたら“Contact Us”からお知らせください。ご要望にお応えできるように努力いたします。

このブログはあくまでも個人的な見解であり、投資判断は各自でお願い致します。当ブログは一切の投資損益に対する責任を負いません。

ホームページに来て下さってありがとうございます。明日もよろしくお願いいたします。

If you have some request to analyze, please write to “Contact Us”.

We do best effort for your request.

These are only personal opinions on this blog, and you need the investment judgment in each one. This blog doesn’t assume the responsibility to all the investment profit and loss.

Thank for watching our contents. My best regards next day.

如果您需要行情分析,请点击“Contact Us”联系我们。我们将尽力满足您的要求。

本博客仅为个人意见,请各自做出投资判断。本博客概不对任何投资盈亏负责。

感谢您访问本博客。欢迎再次使用。

© 2024 Retar