2018/08

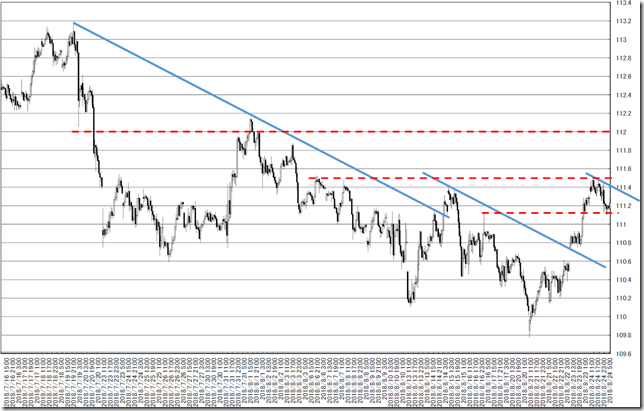
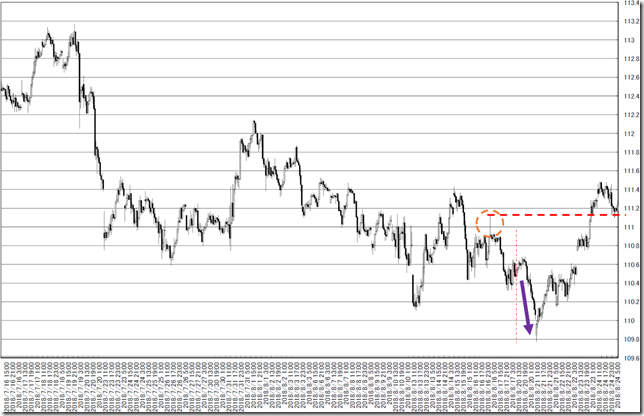
ドル円1時間足・112円lowを超えない限り売り戻しで臨みたい・レジスタンスは111.4、111.8、112.1円・小さな値幅を細かくとる相場

2018/08/27

ドル円1時間足・112円lowを超えない限り売り戻しで臨みたい・レジスタンスは111.4、111.8、112.1円・小さな値幅を細かくとる相場

USDJPY hourly; if the price will not cut 112yen, our tactics will be “Sell on high”; Resistances are 111.4yen, 111.8yen and 112.1yen.

美元/日元。如果价格不会超112日元,我们的策略将是“卖高价”。电阻是111.4日元,111.8日元和112.1日元。


今週の結論は、大枠では引き続き107円~113円のレンジだとみています。

先週は下を試したので、今週は上から。

注目したいのはレンジの切り下げとなるのかどうか。

レンジ相場は、止まりそうなところの候補の提示はできますが、「ここで上限」っていうのはできません。

狙うのはレンジとレンジの間のチョビットの区間。

Our conclusion is the range will still be from 107yen to 113yen.

In last week, the price challenged the lower side limit and this week will be upper side challenge.

We want to see the limit will go lower side or not.


「ドル円1時間足・ジリジリ下がるようなイメージ・大きな値幅は狙えそうもないが売り目線で臨みたい」(2018/8/20)

「ドル円1時間足・109円Highを割れていくなら、下落トレンドが出てきそう」(2018/8/13)

下がりたくなかったようです。(紫)

下方向は気がすんだので、今度は上ということでしょう。

We reported “USDJPY hourly; this market seems to be bear market; a big opportunity will not come but selling seems to be profitable” in 8/20/2018.

We reported “USDJPY hourly; if the price will cut 109yen high, falling trend will come” in 8/13/2018.

The price did not want to fall.

We confirmed lower side limit and next is upper side limit.

chart1_conv


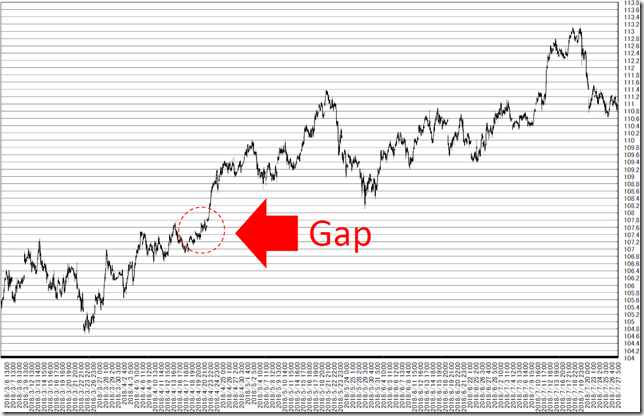
オセアニア時間帯抜きの足です。

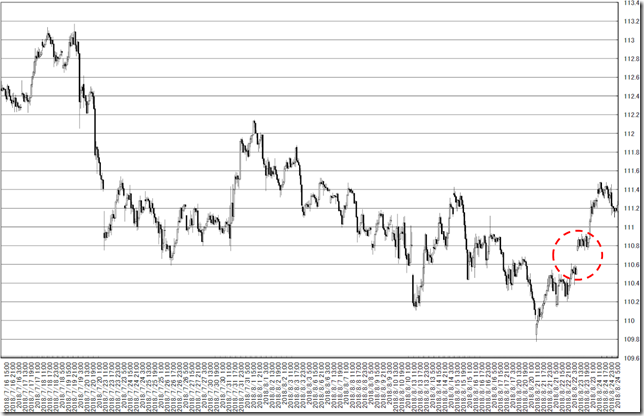
110.60-80円にかけて新たな窓です。

107円台に窓を3つ残しています。

長い時間をかけ112円台の窓は埋まりました。

「107円の窓だって絶対に埋まる」と思うのが人情です。

These are latest candle sticks without Oceania time.

The price remained a gap from 110.60yen to 110.80yen.

There remained 3 gaps in 107yen around.

chart2_convchart3_conv


111円を割らずに反転すると上値狙いでしょう。

それとも窓が埋まるのか???

いずれにせよ、上方向のどこでとまるかに注目です。

If the price will not cut 111yen even, rally will start.

Or a new gap may bury.

In any way, we need to watch “Where is the upper side limit”.

chart4_conv


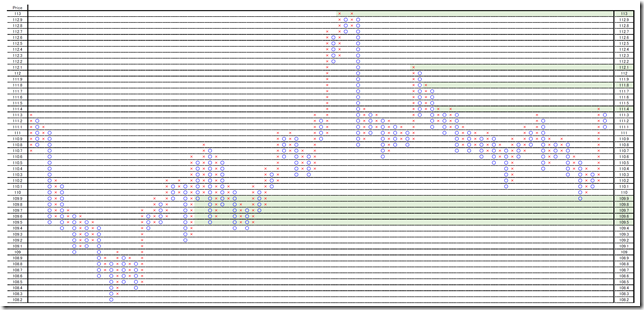
1時間足を使用しオセアニア時間帯を省いたP&Fです。

一応、トリプルトップを形成しているので、新高値から買ってみたいところです。

下方向は109円Highのサポートを確認できた状態です。

This is 0.1 price change and 3 box reversal close price’s Point and Figure chart.

The price forms triple top and we want to buy from the new high.

We confirmed 109yen high worked as support.

PF


★★レポート作成時データのダウンロード★★

ブログで使用したデータをダウンロードしていただけます。

内容により非提供の場合があります。


相場分析のリクエストがありましたら“Contact Us”からお知らせください。ご要望にお応えできるように努力いたします。

このブログはあくまでも個人的な見解であり、投資判断は各自でお願い致します。当ブログは一切の投資損益に対する責任を負いません。

ブログに来て下さってありがとうございます。明日もよろしくお願いいたします。

If you have some request to analyze, please write to “Contact Us”.

We do best effort for your request.

These are only personal opinions on this blog, and you need the investment judgment in each one. This blog doesn’t assume the responsibility to all the investment profit and loss.

Thank for watching our contents. My best regards next day.

如果您需要行情分析,请点击“Contact Us”联系我们。我们将尽力满足您的要求。

本博客仅为个人意见,请各自做出投资判断。本博客概不对任何投资盈亏负责。

感谢您访问本博客。欢迎再次使用。


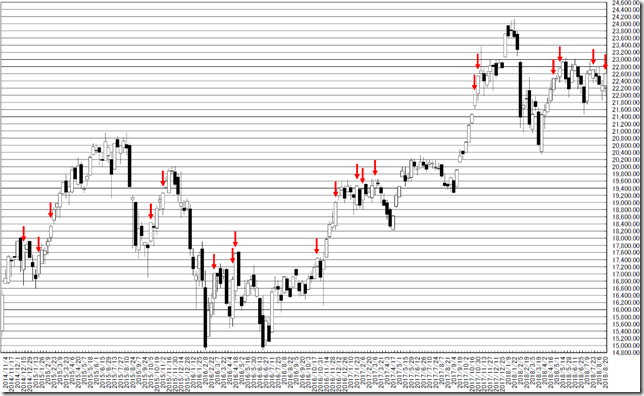
日経平均週足・羽黒4号線・22800.61円試しの型・実体抜きするならBull

2018/08/26

日経平均週足・羽黒4号線・22800.61円試しの型・実体抜きするならBull

N225 weekly is “HAGURO” No.4; the price will challenge 22800.61yen and if the price will cut with candle stick body, we can confirm bull trend.

日经225。羽黑4号线。价格将挑战22800.61日元。如果价格上涨从蜡烛棒体,我们可以确认牛市趋势。


今週は強気トレンド入りしたのか、確認の週です。

もし翌週に22800.61円を実体抜きするようならば、23000円試しとなるとみています。

しかし、「2018/8/27-29に今年最高の「変化日」集中期間」(2018/8/7)と報告しており、また、満月(2018/8/26)もあります。

In next week, we need to confirm bull trend or not in next week.

If the price will cut with candle stick body, the price will challenge 23000yen.

And we also reported ““HENKABI” are concentrated from 8/27-29/2018” in 8/7/2018 and 8/26/2018 is full moon.


「日経平均週足・羽黒3号線・下げ止まり感が出やすいが22380.28円を実体抜きするかに注目」(2018/8/17)

「日経平均週足・羽黒14(15)号線・レジスタンスは22800.61円に切り下がり分かりやすくなった・しばらく弱気で臨みたい」(2018/8/11)

We reported “NIKKEI 225 Weekly; “HAGURO” No. 3 formation; now may be falling stop and we need to watch the price will cut 22380.28yen with white candle stick body” in 8/17/2018.

We reported “N225 weekly is “HAGURO” No. 14(15) formation; Resistance point becomes 22800.61yen; we will bearish for some time” in 8/11/2018.


日経225週足線は羽黒4号線となりました。

日経225週足線では200週で羽黒4号線は19回出現しています。

基本的にブルトレンドで出る足です。

離れて寄り付くと、トレンド継続が多かったようです。

In this week, N225 formed “HAGURO” No. 4 formation.

In past 200 weeks, N225 price formed “HAGURO” No. 4 formation was 19 times.

This formation implies “now is bull trend”.

Jumping of price often became rally continue.

chart1_conv


★★レポート作成時データのダウンロード★★

ブログで使用したデータをダウンロードしていただけます。

内容により非提供の場合があります。


相場分析のリクエストがありましたら“Contact Us”からお知らせください。ご要望にお応えできるように努力いたします。

このブログはあくまでも個人的な見解であり、投資判断は各自でお願い致します。当ブログは一切の投資損益に対する責任を負いません。

ブログに来て下さってありがとうございます。明日もよろしくお願いいたします。

If you have some request to analyze, please write to “Contact Us”.

We do best effort for your request.

These are only personal opinions on this blog, and you need the investment judgment in each one. This blog doesn’t assume the responsibility to all the investment profit and loss.

Thank for watching our contents. My best regards next day.

如果您需要行情分析,请点击“Contact Us”联系我们。我们将尽力满足您的要求。

本博客仅为个人意见,请各自做出投资判断。本博客概不对任何投资盈亏负责。

感谢您访问本博客。欢迎再次使用。

© 2024 Retar