2019/03

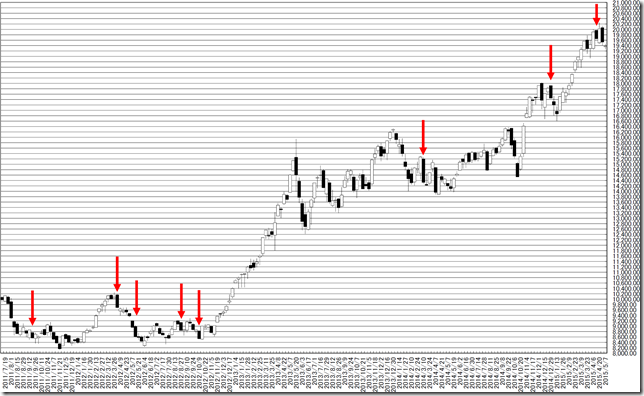
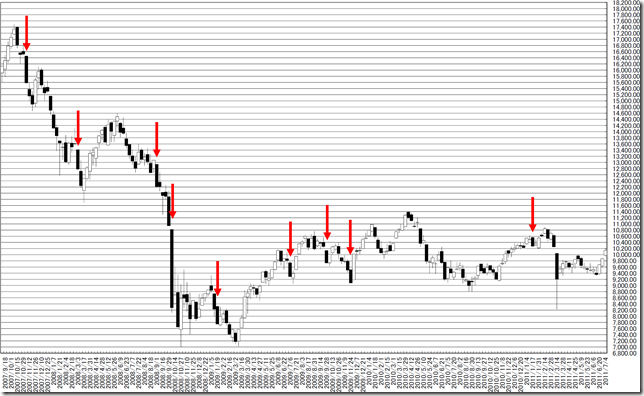
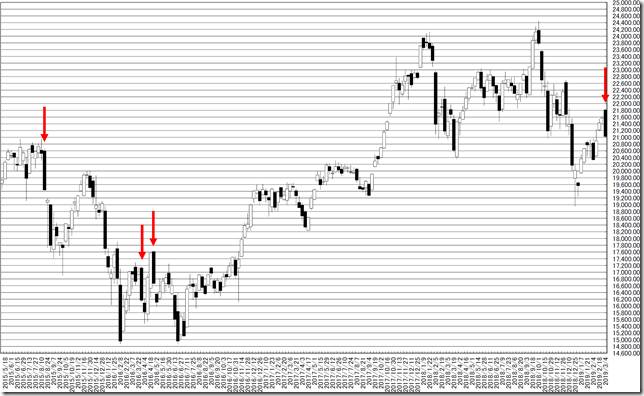
日経平均週足・羽黒11(16)号線・高値圏で示現したため、しばらくは21860.39円を超えることはない

2019/03/08

日経平均週足・羽黒11(16)号線・高値圏で示現したため、しばらくは21860.39円を超えることはない

NIKKEI 225 week; “HAGURO” No. 11(16) formation; this formation appears in higher zone and the price will not go 21860.39yen over for some time.

日经225。羽黑11(16)号线。因为它出现在较高的区,所以价格也不会去21860.39日元过一段时间。


本日は日経225週足についてです。

結論は最低でも1ヶ月ぐらいは買建ない。

Today is about N225 weekly.

Our conclusion is you should not hold long position for one month over.


日経225週足線は羽黒11(16)号線となりました。

日経225週足線では600週で羽黒11(16)号線は21回出現しています。

高値圏で示現しました。

昨年の高値圏でも見たことのない線です。

最低でも1ヶ月程度は、新高値をとれないことがほぼ確定的です。

In this week, N225 formed “HAGURO” No. 11(16) formation.

In past 600 weeks, N225 price formed “HAGURO” No. 11(16) formation was 21 times.

This formation appears in higher zone.

We did not see this formation in last year higher zone.

At least, we will not see new high for a month.

chart1_convchart2_convchart3_conv


★★レポート作成時データのダウンロード★★

ブログで使用したデータをダウンロードしていただけます。

内容により非提供の場合があります。


相場分析のリクエストがありましたら“Contact Us”からお知らせください。ご要望にお応えできるように努力いたします。

このブログはあくまでも個人的な見解であり、投資判断は各自でお願い致します。当ブログは一切の投資損益に対する責任を負いません。

ブログに来て下さってありがとうございます。明日もよろしくお願いいたします。

If you have some request to analyze, please write to “Contact Us”.

We do best effort for your request.

These are only personal opinions on this blog, and you need the investment judgment in each one. This blog doesn’t assume the responsibility to all the investment profit and loss.

Thank for watching our contents. My best regards next day.

如果您需要行情分析,请点击“Contact Us”联系我们。我们将尽力满足您的要求。

本博客仅为个人意见,请各自做出投资判断。本博客概不对任何投资盈亏负责。

感谢您访问本博客。欢迎再次使用。


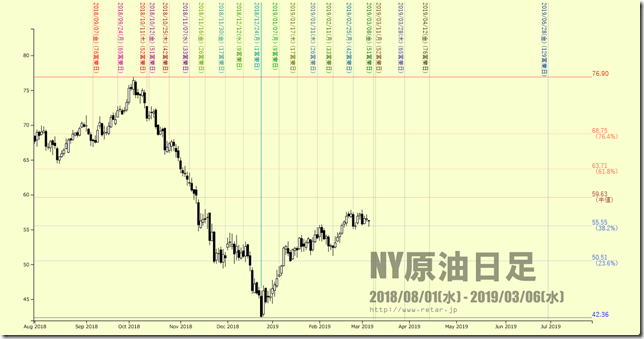
NY原油日足・しばらくは60ドル~40ドルの間で推移

2019/03/07

NY原油日足・しばらくは60ドル~40ドルの間で推移

West Texas Intermediate (WTI) Daily; the price will keep lower for some time; main range will be from 60 dollar to 40 dollar.

西德克萨斯中质油(WTI)。价格将保持较低的一段时间。 主要范围将从60美元到40美元。


本日はNY原油についてです。

結論は「50ドルプラマイ10ドル」というのは誰も文句を言わない状況なのでしょう。

Today’s analyze is West Texas Intermediate (WTI).

Our conclusion is from 60 dollar to 40 dollar will be cozy price.

直近下落の半値押しに失敗しています。

The price fails to recover the half price.

chart1


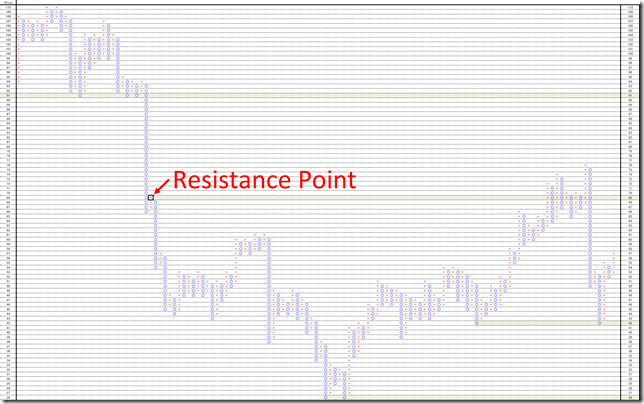
日足のポイントアンドフィギュアです。

1枠1ポイント、3枠転換の終値ポイントアンドフィギュアです。

商品相場が大好きなダブルボトムでの反転です。

原油は安ければ誰もなにも言いません。上昇するから問題となります。

This is Point and Figure chart written by daily data.

This is 1 point price change and 3 box reversal close price’s Point and Figure chart.

The price took double bottom.

Someone says “Higher oil has problem” but everyone can accept chap oil.

PF_conv


★★レポート作成時データのダウンロード★★

ブログで使用したデータをダウンロードしていただけます。

内容により非提供の場合があります。


相場分析のリクエストがありましたら“Contact Us”からお知らせください。ご要望にお応えできるように努力いたします。

このブログはあくまでも個人的な見解であり、投資判断は各自でお願い致します。当ブログは一切の投資損益に対する責任を負いません。

ブログに来て下さってありがとうございます。明日もよろしくお願いいたします。

If you have some request to analyze, please write to “Contact Us”.

We do best effort for your request.

These are only personal opinions on this blog, and you need the investment judgment in each one. This blog doesn’t assume the responsibility to all the investment profit and loss.

Thank for watching our contents. My best regards next day.

如果您需要行情分析,请点击“Contact Us”联系我们。我们将尽力满足您的要求。

本博客仅为个人意见,请各自做出投资判断。本博客概不对任何投资盈亏负责。

感谢您访问本博客。欢迎再次使用。

© 2025 Retar