ドル円1時間足・重要な節は107.90円、109.60円・戻りは108円ミドルでは上値が重い
USDJPY hourly; watershed prices are 107.90yen and 109.60yen; 108yen middle will be resistance.
美元/日元。分水岭价格是107.90日元和109.60日元。
阻力是108日元中间。
結論は値段の重要な節は107.90円、109.60円。戻りは108円ミドルでは上値が重い。
Our conclusion is watershed prices are 107.90yen and 109.60yen and 108yen middle will be resistance.
「ドル円1時間足・引き続き109円台の持ち合いを想定・110円台または108円台に乗せたらついていきたい」(2019/12/30)
「ピンポーン」でした。
We reported “USDJPY hourly; now is still range market in 109yen around; we want to follow cutting direction” in 12/30/2019.
This report is almost proper.
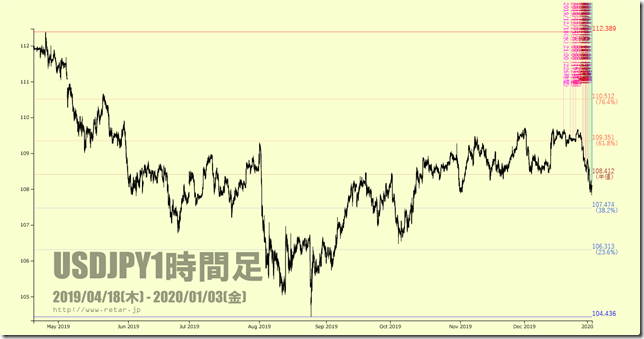
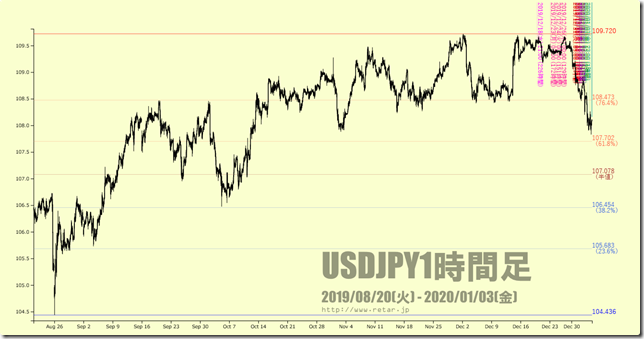
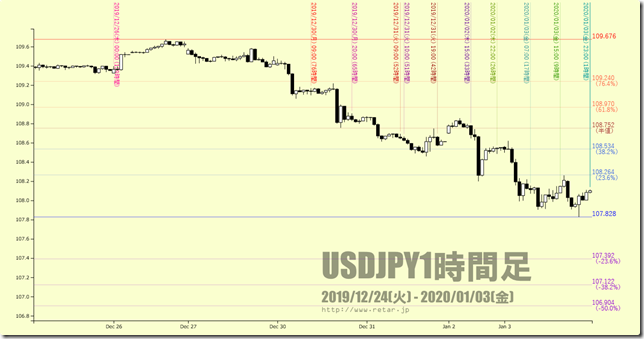
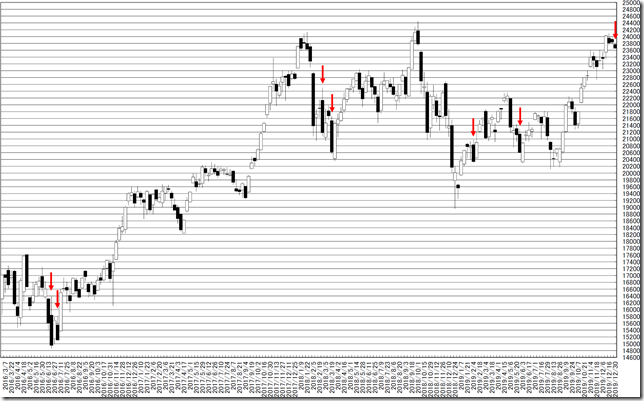
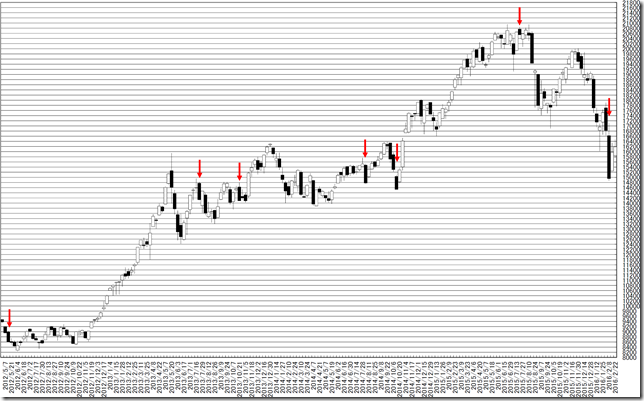
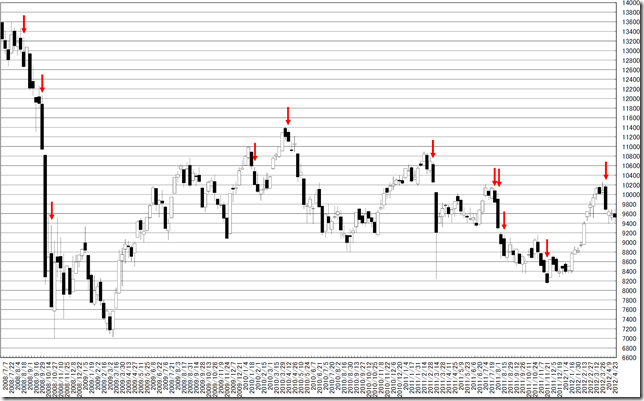
直近のフィボナッチと大枠のフィボナッチです。
適切なフィボナッチに「〇」、不適切なものには「×」をつけています。
一番長期のフィボが参考になるとみています。
ダブルしていますし、108円ミドルが半値です。
These are four types of Fibonacci.
Proper Fibonacci are “〇”.
And inadequate Fibonacci are “×”.
The major chart will be reference.
Now is double dipped and 108yen middle will be resistance.
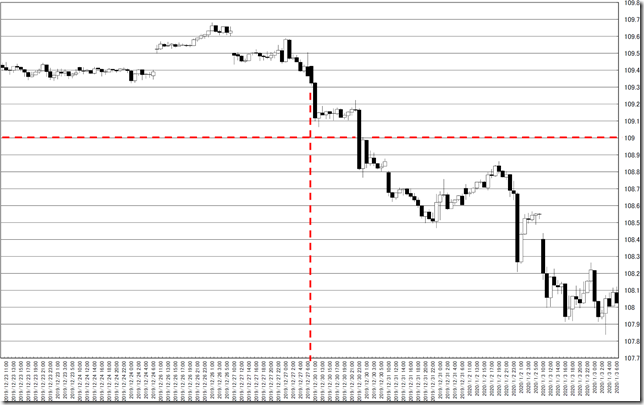
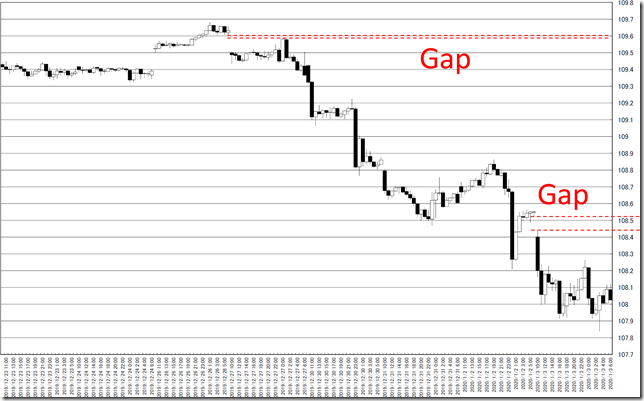
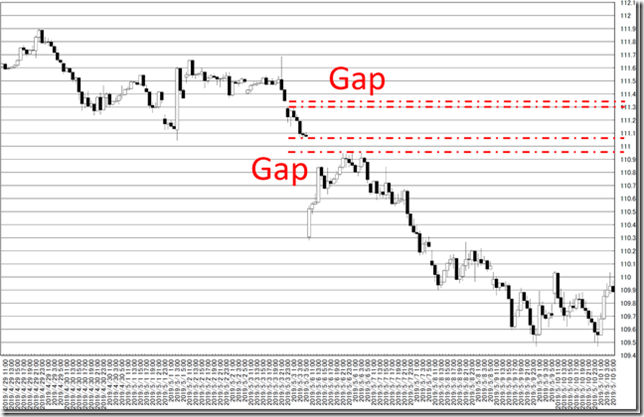
オセアニア時間帯抜きの足です。
108.50円に新しい窓です。
109.60円、111.30-40円、111円イーブンに窓です。
These are latest candle sticks without Oceania time.
New gap appeared at 108.50yen.
There remained gaps at 109.60yen, 111.3-40yen and 111yen even.
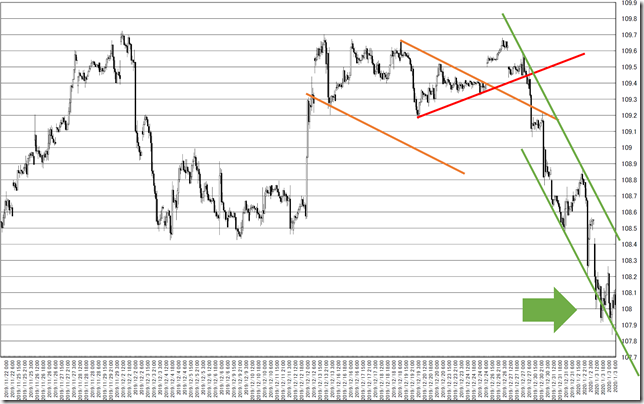
トレンドラインです。
緑が割れているので、下は一旦終わりかもしれません。
This is trend line analysis.
The price cut the green line and bear trend may end once.
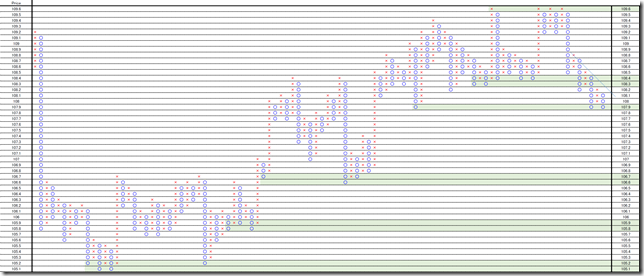
1時間足を使用しオセアニア時間帯を省いたP&Fです。
107.90円で3点底、109.60円で4点天井。
抜けた方がトレンドになりそうな分かり易い状況です。
This is 0.1 price change and 3 box reversal close price’s Point and Figure chart.
The price 3 points dipped at 107.90yen and 4 points topped at 109.60yen.
Cutting will be trend.
相場分析のリクエストがありましたら“Contact Us”からお知らせください。ご要望にお応えできるように努力いたします。
このブログはあくまでも個人的な見解であり、投資判断は各自でお願い致します。当ブログは一切の投資損益に対する責任を負いません。
ブログに来て下さってありがとうございます。明日もよろしくお願いいたします。
If you have some request to analyze, please write to “Contact Us”.
We do best effort for your request.
These are only personal opinions on this blog, and you need the investment judgment in each one. This blog doesn’t assume the responsibility to all the investment profit and loss.
Thank for watching our contents. My best regards next day.
如果您需要行情分析,请点击“Contact Us”联系我们。我们将尽力满足您的要求。
本博客仅为个人意见,请各自做出投资判断。本博客概不对任何投资盈亏负责。
感谢您访问本博客。欢迎再次使用。

