2021/10

日経平均週足・羽黒12(13)号線・高値圏で出現すると下落しやすい傾向

2021/10/09

日経平均週足・羽黒12(13)号線・高値圏で出現すると下落しやすい傾向

NIKKEI 225 weekly is “HAGURO” No.12(13) formation; when this formation appears in higher zone, the price often falls.

日经225。羽黑12(13)号线。当这种形态出现在较高的区域时,价格往往会下跌。


本日は日経225についてです。

Today is about N225 Weekly.


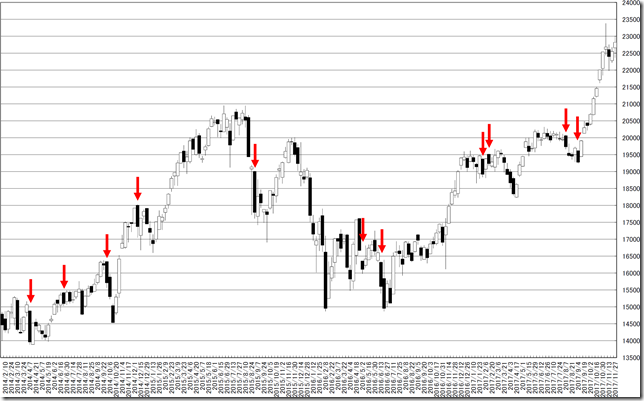
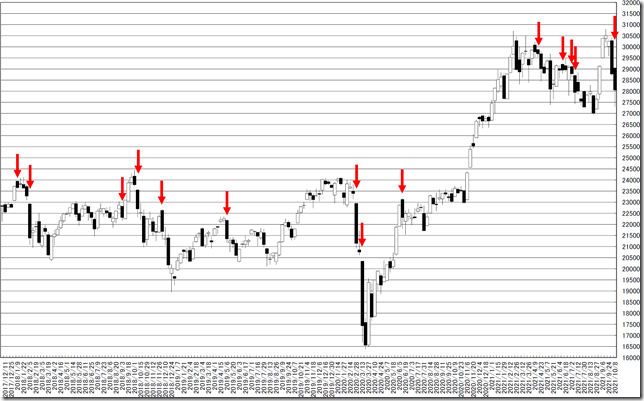
日経225週足線は羽黒12(13)号線となりました。

日経225週足線では400週で羽黒12(13)号線は25回示現しています。

高値圏で出ると上値が重くなる傾向です。

In this week, N225 formed “HAGURO” No. 12(13) formation.

In past 400 weeks, N225 price formed “HAGURO” No. 12(13) formation was 25times.

We can see this formation implies rally becomes difficult.

chart1_convchart2_conv


+++++++++++++++++++++++++++++++++++++++++++++++++++++++++++

相場分析のリクエストがありましたら“Contact Us”からお知らせください。ご要望にお応えできるように努力いたします。

このブログはあくまでも個人的な見解であり、投資判断は各自でお願い致します。当ブログは一切の投資損益に対する責任を負いません。

ブログに来て下さってありがとうございます。明日もよろしくお願いいたします。

If you have some request to analyze, please write to “Contact Us”.

We do best effort for your request.

These are only personal opinions on this blog, and you need the investment judgment in each one. This blog doesn’t assume the responsibility to all the investment profit and loss.

Thank for watching our contents. My best regards next day.

如果您需要行情分析,请点击“Contact Us”联系我们。我们将尽力满足您的要求。

本博客仅为个人意见,请各自做出投资判断。本博客概不对任何投资盈亏负责。

感谢您访问本博客。欢迎再次使用。


ドル円1時間足・とりあえずはダブルトップ・新高値をとりブレークすれば、ターゲット114円ミドル

2021/10/04

ドル円1時間足・とりあえずはダブルトップ・新高値をとりブレークすれば、ターゲット114円ミドル

USDJPY hourly; the price forms double top; if the price will break up side, the target is 114yen middle.

美元/日元。价格形成双顶。 如果价格将向上突破,目标是 114 日元中间。


結論は、とりあえずはダブルトップ・新高値をとりブレークすれば、ターゲット114円ミドル。

Our conclusion is the price forms double top; if the price will break up side, the target is 114yen middle.


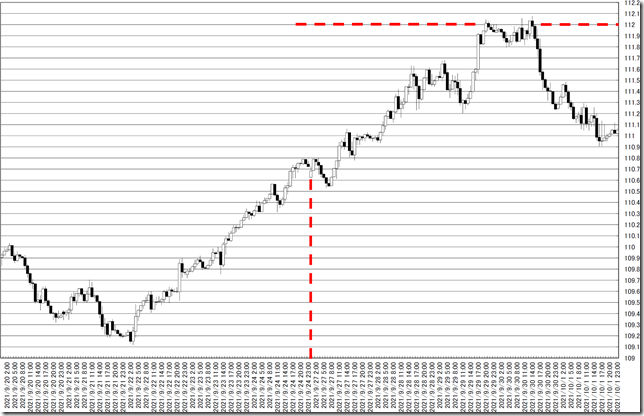
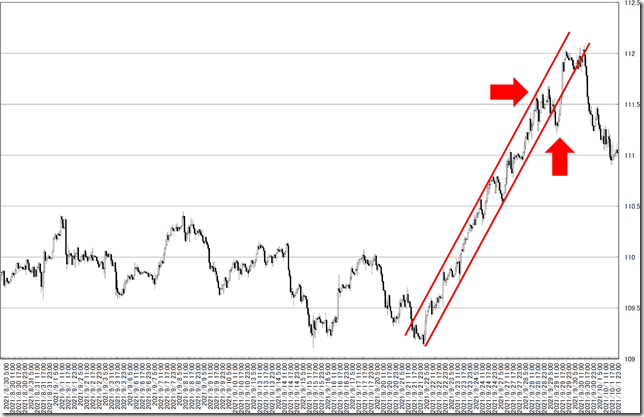
ドル円1時間足・レンジ上限で越週、ブレークすれば111円台後半

ピンポーンです。

USDJPY hourly; now is upper side of the range; breaking target will be 111yen high.

This report was almost proper.

chart0_conv


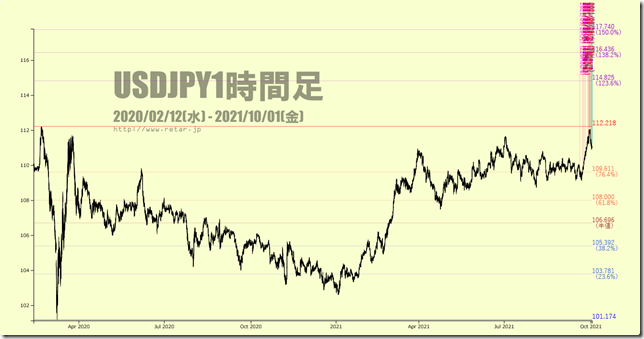
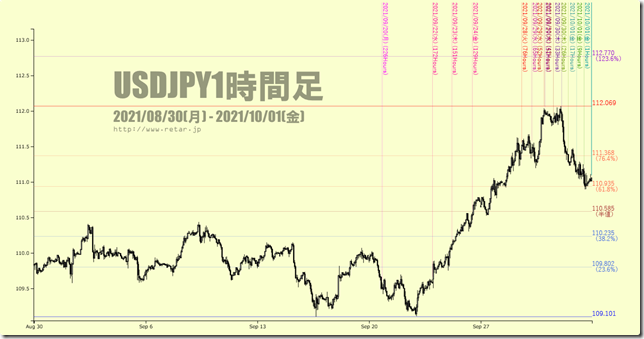
直近のフィボナッチと大枠のフィボナッチです。

ダブルトップになりました。

These are Fibonacci charts.

The price forms double top.

Chart1Chart2


トレンドラインです。

アイディアはありません。

This is trend line analysis.

We have no idea.

chart3_conv


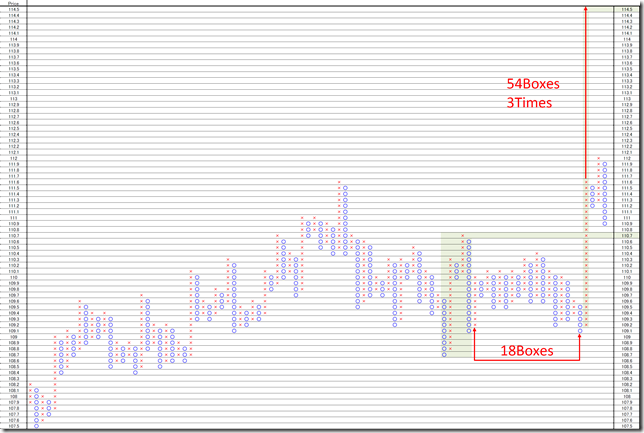
1時間足のP&Fです。

前回高値でサポートされれば、踏み台運動になりそうです。

This is 0.1 price change and 3 box reversal close price’s Point and Figure chart.

Last high will work as support, the price may take new high.

PF_conv


+++++++++++++++++++++++++++++++++++++++++++++++++++++++++++

相場分析のリクエストがありましたら“Contact Us”からお知らせください。ご要望にお応えできるように努力いたします。

このブログはあくまでも個人的な見解であり、投資判断は各自でお願い致します。当ブログは一切の投資損益に対する責任を負いません。

ブログに来て下さってありがとうございます。明日もよろしくお願いいたします。

If you have some request to analyze, please write to “Contact Us”.

We do best effort for your request.

These are only personal opinions on this blog, and you need the investment judgment in each one. This blog doesn’t assume the responsibility to all the investment profit and loss.

Thank for watching our contents. My best regards next day.

如果您需要行情分析,请点击“Contact Us”联系我们。我们将尽力满足您的要求。

本博客仅为个人意见,请各自做出投资判断。本博客概不对任何投资盈亏负责。

感谢您访问本博客。欢迎再次使用。

© 2025 Retar