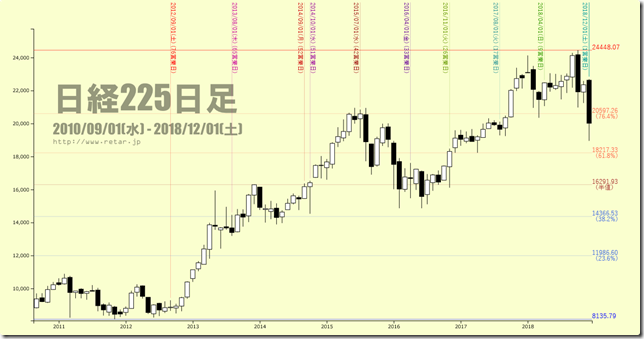
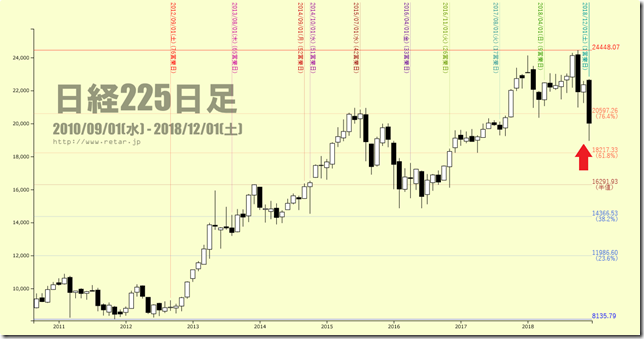
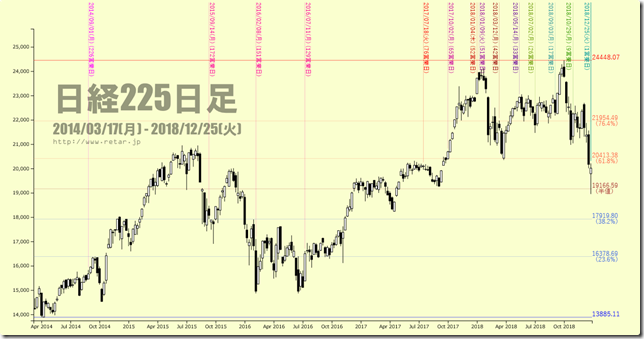
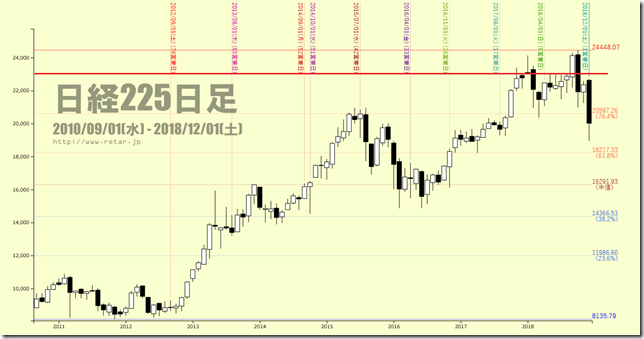
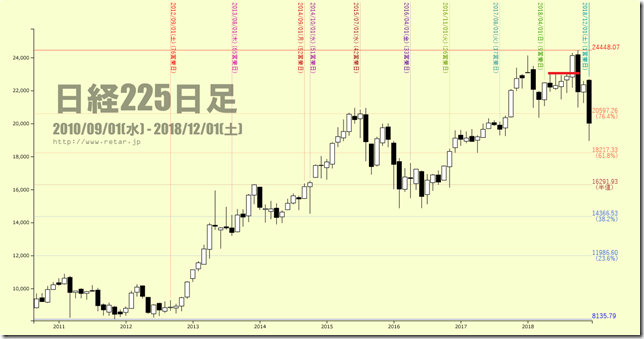
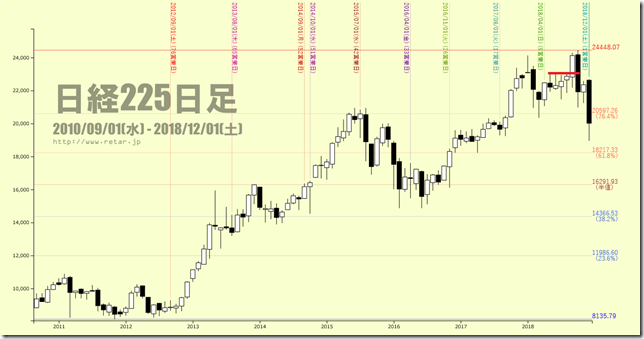
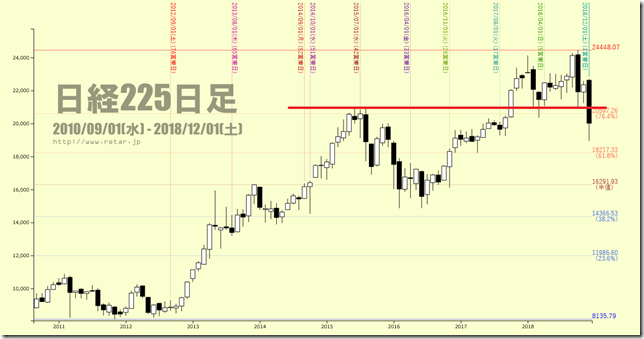
2018年の日経225年足を振り返る
2018年の日経225年足を振り返る
Reviewing our yearly N225 Reports in 2018
回顾在2018年,我们的年度报告日经225。
あけましておめでとうございます。
A happy new year!
新年快乐!
本日は昨年の日経平均年足の分析の反省会をおこないます。
昨年は全部で16回のレポートをお届けしました。
Today, we review our N225 reports in 2018.
We reported 16 times.
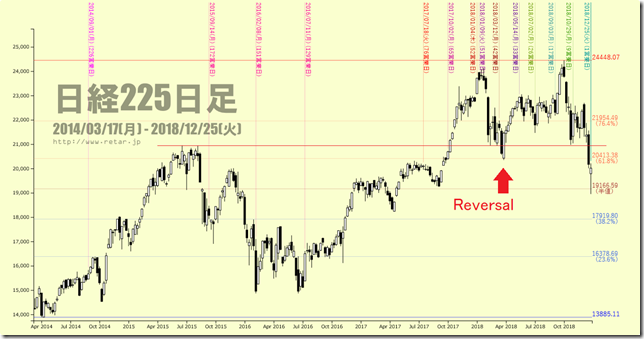
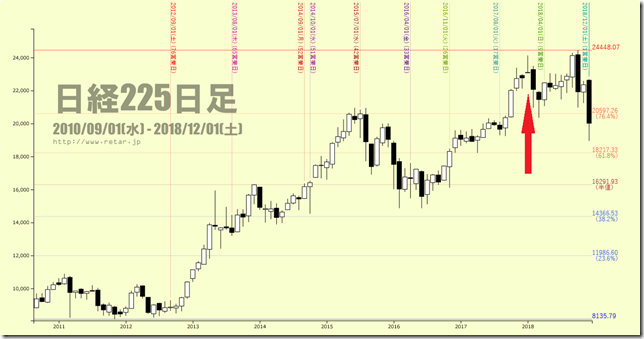
「日経平均年足の分析(1)・上昇するなら20952.71円を割らずに押しを入れてから新高値を取るパターンでは」(2018/1/1)
評価・×
反転地点は評価できます。
ただし、その付近というべきでした。
今後はこの地点を境にサポートとレジスタンスが反転するとみています。
Reversal point was correct.
But we should suggest this price zone around.
This zone will be resistance in future.
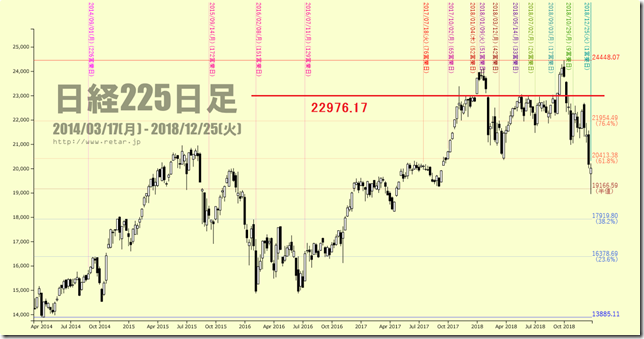
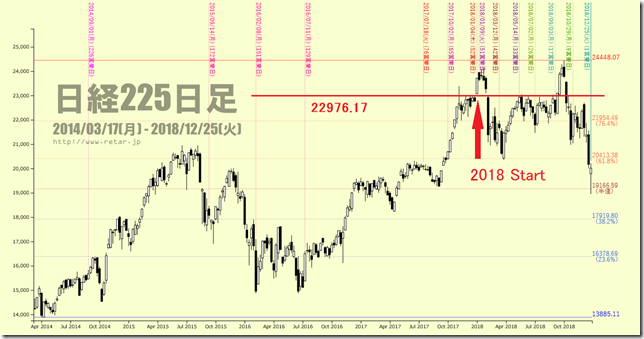
「日経平均年足の分析(2)・1987年年末と1991-1992年の22976.17円付近での値動きと比較すると2018年は強気になれない」(2018/1/3)
評価・△
安値付近で引けたので結果的には強気になれないと言う意味で正解です。
しかし、年初から23000円を超えていった点は大いに反省するべきです。
もうちょっとモムとみていました。
Yearly close was close to year low and this report is almost proper.
But yearly open cut 23000yen over and this is introspective.
「日経平均年足の分析(3)・1988年と1990年の様相・22976.17円は躊躇なく突き抜けた値段」(2018/1/4)
評価・〇
『今後の標語は「心に刻もう22976.17円」』と決定しました。
標語は学習の成果です。
はやめに理解できたのが大切でした。
We find out “We will need to remind 22976.17yen in future!”
We defined good phrase.
「日経平均年足の分析(4)・大発会の暴騰・ 22976.17円を割り込まなければ強気・4月の底で買い夏至前に売るのがチャンスかも?」(2018/1/7)
評価・〇
概ね評価できると思います。
This report was almost proper.
「日経平均年足の分析(5)・1950年代以降、同時線チックな1月の足は幸先が悪い」(2018/2/14)
評価・〇
概ね評価できると思います。
1月足にその後が暗示されていたわけです。
This report was almost proper.
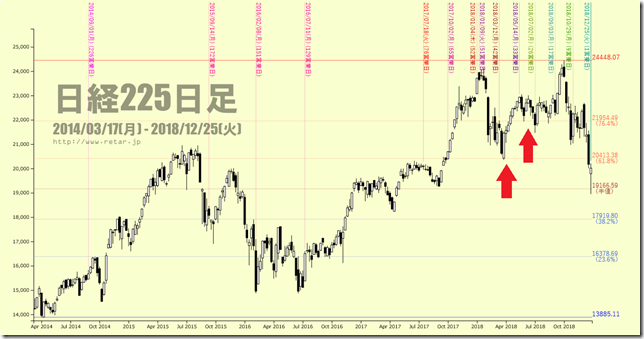
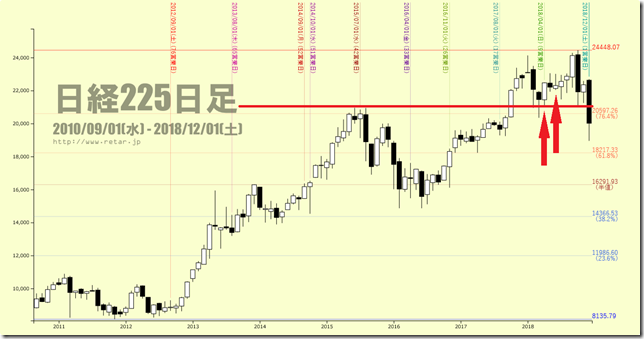
「日経平均年足の分析(6)・2018/04、2018/06の月末クローズが21000円割れとならなければ年後半は堅調かも?」(2018/3/8)
評価・△
「心に刻もう22976.17円、20952.71円」
この時点で標語が変更されています。
10月高値を想定したものと考えればいいでしょう。
その時点では12月の下落は想定外でした。
We change our slogan, “We need to remind 22976.17yen and 20952.71yen. “
This report suggested October high.
And this report cannot imply December falling.
「日経平均年足の分析(7)・1950年以降の月足「陰―陽―陽」かつ「3月に安値」では、秋までタレて年後半に上昇」(2018/4/2)
評価・△
23000円手前で抑え込まれた点を評価したいと思います。
10月高値を想定したものと考えればいいでしょう。
その時点では12月の下落は想定外でした。
This report suggested October high.
And this report cannot imply December falling.
「日経平均年足の分析(8)・1950年以降・6月クローズまでに年初来高値をとらないと年後半のパフォーマンスは悪い・なんとなく2007年にも似てきているのも気になる」(2018/4/3)
評価・〇
概ね評価できると思います。
10月の下落を暗示していたのだと思います。
This report was almost proper.
This report implied falling in October.
「日経平均年足の分析(9)・1950年以降の1月に年初来高値、3月に年初来安値のパターン・初夏に下げ開始または押し・2001年、2008年にも似てきた」(2018/5/1)
評価・〇
7月の押しを想定したものです。
概ね評価できると思います。
この時点からはズリズリ下方向にはいきませんでした。
This report implied dipped in July.
This report was almost proper.
「「日経平均年足の分析(10)・1950年以降・今のところ1月に年初来高値、5,6月に戻り高値というのは1990年バブル崩壊、2008年リーマンショックに似ている」(2018/7/3)
評価・〇
「2008年、1990年に似てきた」
危機を悟った点を評価したいと思います。
チャートは違う形で実現していますが、やっぱりねということでした。
We reported “Our conclusion is now is similar to 2008 and 1990”.
And we knew a big crisis will come at that time.
「日経平均年足(11)・ヴェリタス2018/7/15日号2P・専門家による「高値―安値」予想・平均的なイメージは秋口に安値、年末に尻上がりのハラミ予想」(2018/7/19)
評価・?
平均値から求めた高値予想は11月上旬に24411.67円。
高値の想定は正しかったということですね。
安値の平均は8月中旬に20971.07円。
The highest expected at that time was 24411.67yen at the beginning of November.
The highest was almost proper.
The lowest average is 20971.07yen in mid-August.
「日経平均年足の分析(12)・3ヶ月超えられないレジスタンスを今月クローズで抜けると1995年相場っぽくなってくる、しかし引き続き「魔坂」感も」(2018/8/2)
評価・〇
概ね評価できると思います。
弱気ながらも高値を示唆するというイメージがこの時点でできました。
This report was almost proper.
「日経平均年足の分析(13)・1990年と共通するのは3ヶ月間新高値を取れず・上昇は掉尾の一振に期待」(2018/8/31)
評価・×
掉尾の一振はありませんでした。
The end of the last year was not rally.
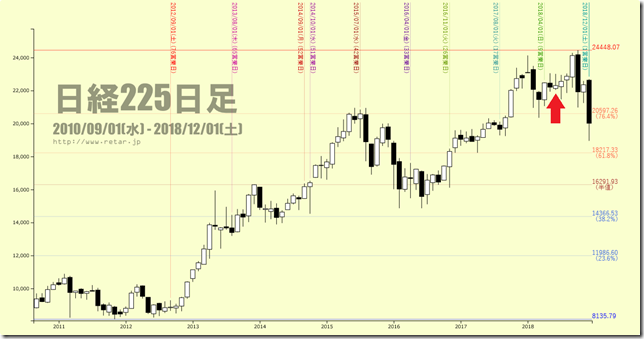
「日経平均年足の分析(14)・1995年相場に似てきた・メインシナリオは23000円を切らない押しの後に「掉尾の一振」」(2018/10/2)
評価・×
高値を取った直後だったため、新高値ドンドンならば、期待できた局面でした。
やはり、25000円を軽々と超えるようでないなら信用できないのです。
This report was written after the new high and if the price will go 25000yen over, now was a big rally.
「日経平均年足の分析(15)・今月は月足5手包み確定、しかもほぼ陰線は確定的・良くてしばらくは下値模索の値がため、悪いと大天井は既に過ぎてしまったのかも」(2018/10/25)
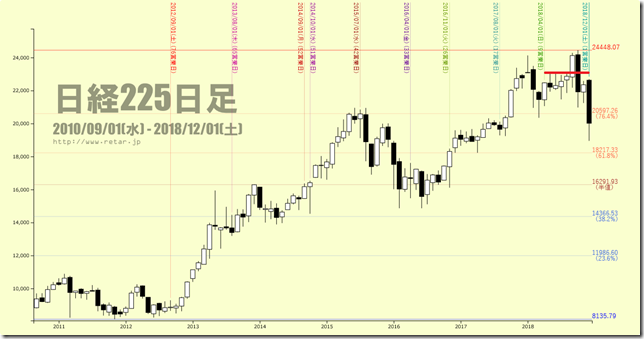
「日経平均年足の分析(16)・今年の年初は23073.73円。バブル以降では年足が陰線になると翌年も続きそう」(2018/12/4)
“NIKKEI 225 annual No.15; this month is 5 bars engulfing; rally will be difficult.”(10/25/2018)
評価・future
ここから先は、2019年のお話しです。
やはり包みからの下抜けを評価するべきだとみています。
包みから抜けたのですから、売方優位であり、既に大天井は過ぎたのがメインシナリオであり、21000円付近までしか戻らないというのがメインシナリオです。
These will need to evaluate in this year.
Cutting from engulfing will be meaningful.
And our main scenario is major peak has gone and recovery high will be 21000yen around.
ブログで使用したデータをダウンロードしていただけます。
内容により非提供の場合があります。
相場分析のリクエストがありましたら“Contact Us”からお知らせください。ご要望にお応えできるように努力いたします。
このブログはあくまでも個人的な見解であり、投資判断は各自でお願い致します。当ブログは一切の投資損益に対する責任を負いません。
ブログに来て下さってありがとうございます。明日もよろしくお願いいたします。
If you have some request to analyze, please write to “Contact Us”.
We do best effort for your request.
These are only personal opinions on this blog, and you need the investment judgment in each one. This blog doesn’t assume the responsibility to all the investment profit and loss.
Thank for watching our contents. My best regards next day.
如果您需要行情分析,请点击“Contact Us”联系我们。我们将尽力满足您的要求。
本博客仅为个人意见,请各自做出投资判断。本博客概不对任何投资盈亏负责。
感谢您访问本博客。欢迎再次使用。

