
NY金回顧。BULLトレンド開始だと思います/NY Gold reminding; We think this might be the bull trend starting./NY金回顾。我们想是牛市倾向开始。

2012/09/01

NY金回顧。BULLトレンド開始だと思います

NY Gold reminding; We think this might be the bull trend starting.

NY金回顾。我们想是牛市倾向开始。


私たちは札幌でトレードをおこなっております。

とっておきのフレッシュなニュースを知る立場にはありません。

不利な立場を克服し、相場に挑むために、私たちには自前で開発した、とっておきの値動きを分析ツール群と計算モデルがあります。

早耳は悔しくありません。

もちろんコンピュータの中だけでは不十分です。

手作業でチャートに線を描くこともとても重要です。

We trade in Sapporo City Japan.

We can not acquire special market information.

But we developed our unique original computer programs to conquer disadvantageous position.

We are not vexed at keen of hearing.

And this is not enough to struggle in the market.

It is also very important to draw a line on a chart manually.


本日はNY金を分析します。

Today we analyze NY gold.


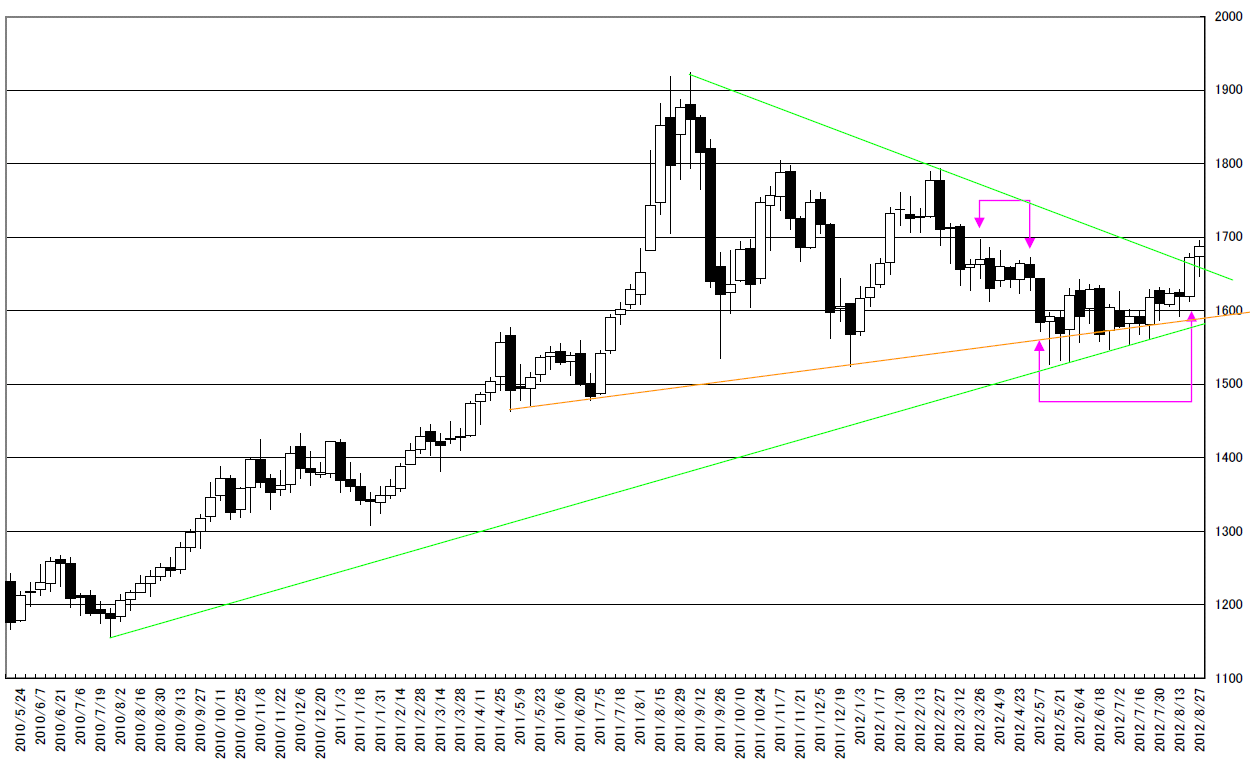
週足です。

ピンクで示したのは3月下旬からの連続した陰陽です。

トレンド待ちの状態でした。

緑で示したレジスタンスとサポートのどちらを抜けるかが勝負とみておりました。

2012/06/24のレポートでは「NY金週足。週足の重要なサポート割れ、下落を要警戒」として、終値がオレンジ色のトレンドラインを割り込んできたことを手がかりに注視してみました。

しかし、この週のみの出来事でした。

This is weekly chart.

There appeared “BLACK–and-WHITE” continuation from end of March and waited for new trend.

We notice green trend lines.

In 06/24/2012 report “NY GOLD Weekly; the market price cut the important support; we think this may become a fall?” notice the orange trend line.

This occurred only this week.
WEEK


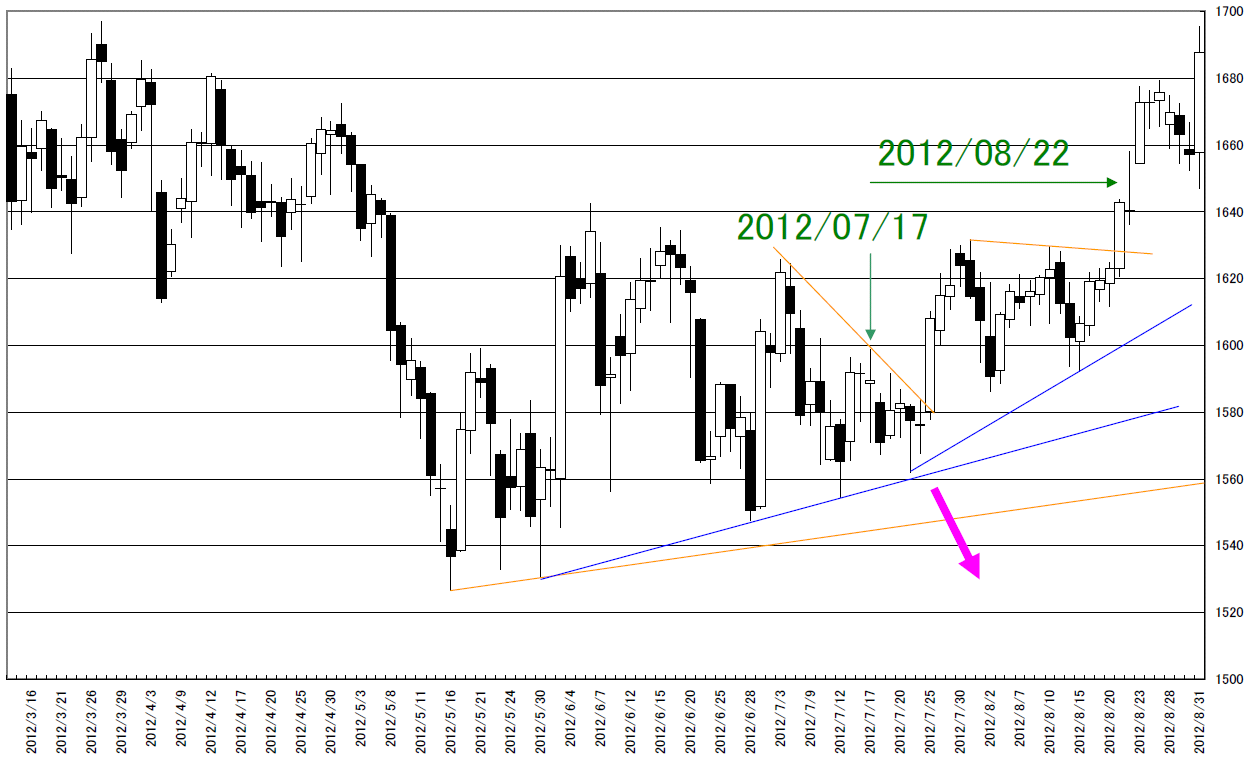
日足です。

「レンジだな」と思っていた期間は長かった。

しかし、私たちが一番警戒したのは2012/07/17「NY金。下落を要警戒ですが、決めうちは禁物」でした。

ここはピンク色の矢印の方向に落っこちはじめてもおかしくない地点に見えたところでした。

昨日の値動きも重要でした。

「押し、戻りは空まで実現するを酒田線の骨子とす」

2012/08/22の上ヒゲは出来高の薄いところだと考えられるため、「準空」といえるところです。

トレンドである証拠はここにもあると思います。

This is daily chart.

The range market was very long.

And we most cautioned in 07/17/2012 “NY GOLD; we still think Gold market may fall but this is only highly possibility”.

In this point, the market price may fall. (Pink arrow)

Last day market was very important.

“In “SAKATA” substance, dip reaches only gap”

In 08/22/2012 case, this is similar to the “gap”.

We think this is another evidence of the trend.
DAY


相場分析のリクエストがありましたら“Contact Us”からお知らせください。ご要望にお応えできるように努力いたします。

このブログはあくまでも個人的な見解であり、投資判断は各自でお願い致します。当ブログは一切の投資損益に対する責任を負いません。

ホームページに来て下さってありがとうございます。明日もよろしくお願いいたします。

If you have some request to analyze, please write to “Contact Us”.

We do best effort for your request.

These are only personal opinions on this blog, and you need the investment judgment in each one. This blog doesn’t assume the responsibility to all the investment profit and loss.

Thank for watching our contents. My best regards next day.
NY原油。98ドルにレジスタンスポイント、83ドルにサポート/West Texas Intermediate (WTI); resistance point is 98point and support point is 83point./西德克萨斯中质原油(WTI),阻力点为98点和支持点是83点。

2012/08/31

NY原油。98ドルにレジスタンスポイント、83ドルにサポート

West Texas Intermediate (WTI); resistance point is 98point and support point is 83point.

西德克萨斯中质原油(WTI),阻力点为98点和支持点是83点。


本日はNY原油についてです。

Today’s analyze is West Texas Intermediate (WTI).


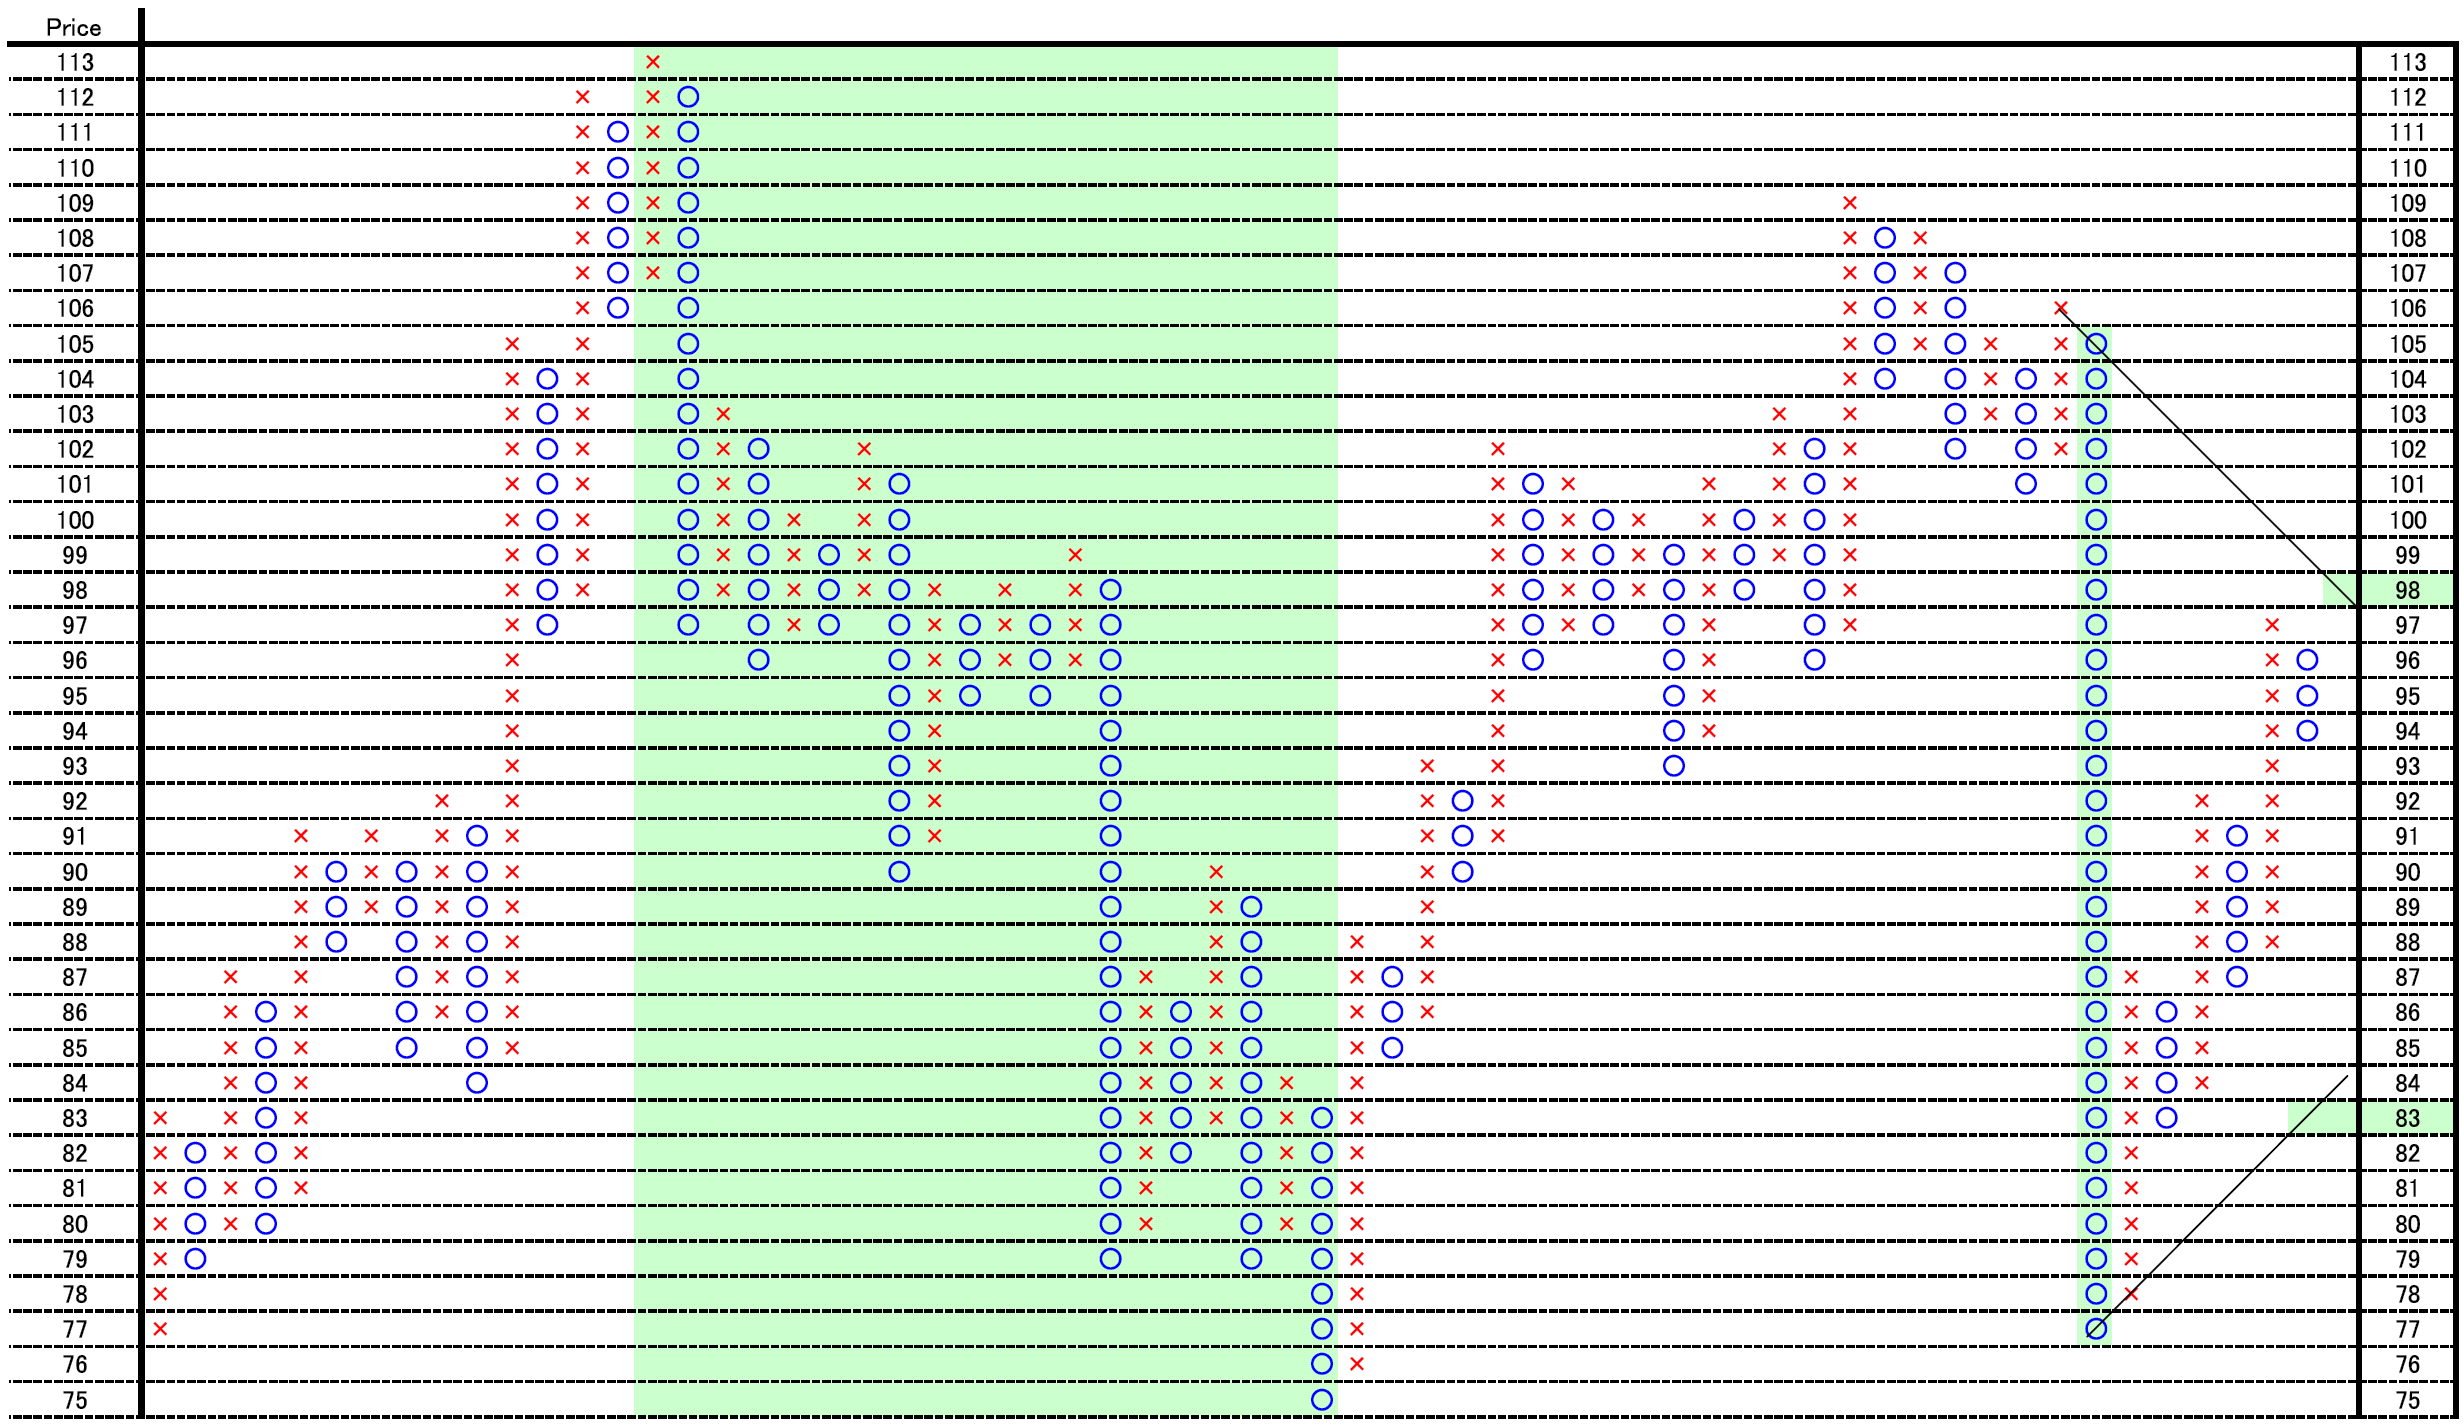
日足のポイントアンドフィギュアです。

1枠1ポイント、3枠転換の終値ポイントアンドフィギュアです。

2012/06/08の通り「NY原油。腰を据えた下落ならターゲット71ポイント」の見方には変更ありません。キャンセルは105ポイント超えです。

目先はハラミからの45度線のブレークに注目です。

現在の上方ブレークは98ポイント、下方ブレークは83ポイントです。

This is Point and Figure chart written by daily data.

This is 1 point price change and 3 box reversal close price’s Point and Figure chart.

Our view in 06/08/2012 “West Texas Intermediate (WTI); if this may become true fall, the target price is 71point” has not changed.

We need to watch the market price cut which direction of 45 degree resistance or support.

The latest upper side breaking point is 98point and down side is 83point.

PF


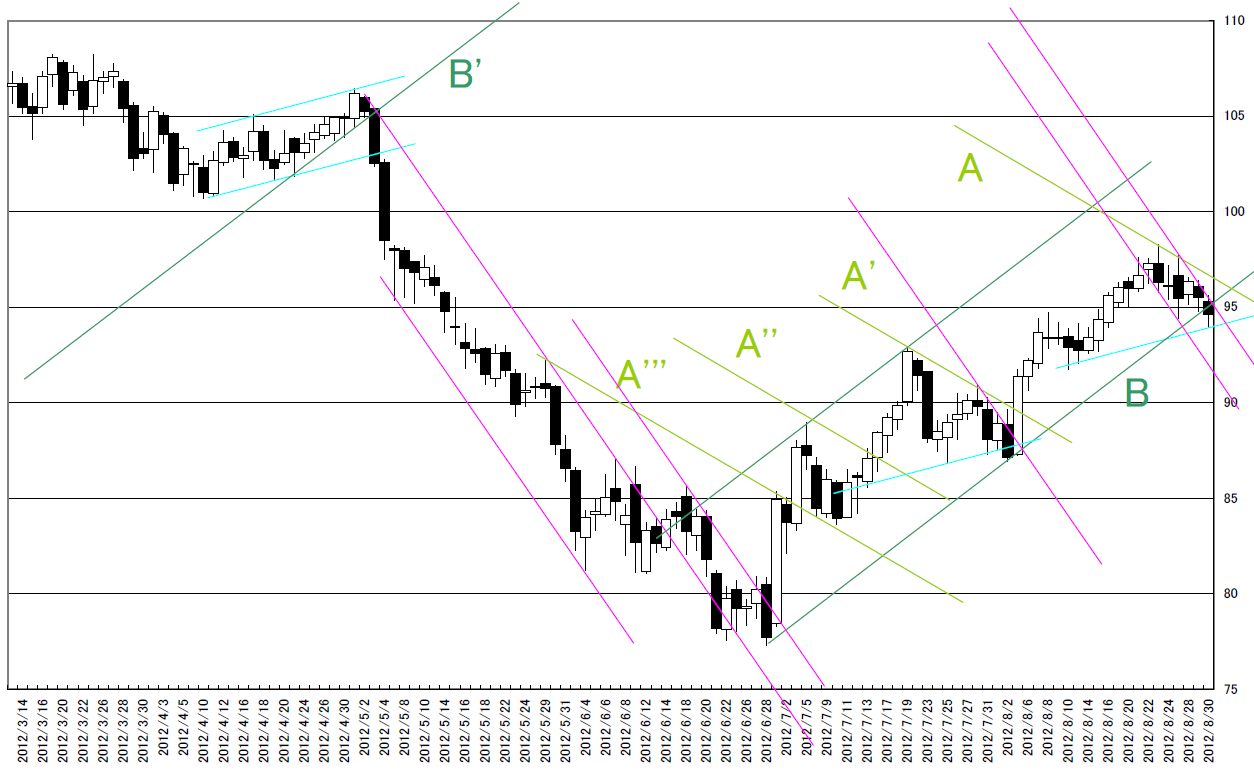
トレンドラインも引きなおしました。

同じ角度のもので色分けしています。

原油チャートのトレンドラインはダマシが少ないと感じます。

A線系列を終値でしっかり越えるところで、LONGを建てるといい感じですね。

同じことが3回続いたので、そろそろ同じ手口は使えないかもしれません。

注目はB線系列です。B線を割り込んだところで、前回は下落に転じています。

もし今ロングを持っていたら、私だったら手仕舞いします。

水色は前回ダマシとなりましたが、ダマシとならない所かもしれません。

ピンクも上値を押さえ込んできているのも注目。

We added trend line on the chart.

We colored same degree lines.

We fell there are few cheats in this chart.

When the market price cut “A” linear series, they were the best point to take long position.

There occurred 3times and we can not use this tactics.

The most notice point is “B” linear series; last time, the market price fall there.

If I have long position, I would close.

The Light-blue line may works as support, but this may cheat.

And pink line appeared; this may work as strong resistance point.

CHART


相場分析のリクエストがありましたら“Contact Us”からお知らせください。ご要望にお応えできるように努力いたします。

このブログはあくまでも個人的な見解であり、投資判断は各自でお願い致します。当ブログは一切の投資損益に対する責任を負いません。

ホームページに来て下さってありがとうございます。明日もよろしくお願いいたします。

If you have some request to analyze, please write to “Contact Us”.

We do best effort for your request.

These are only personal opinions on this blog, and you need the investment judgment in each one. This blog doesn’t assume the responsibility to all the investment profit and loss.

Thank for watching our contents. My best regards next day.
© 2026 Retar
