日経平均日足回顧・2手ツツミは最近の危険信号/Reminding NIKKEI 225 Daily. The recent continuance of two “TSUTSUMI” formations often implies the market reversal./提醒日经225指数报。最近持续了”包围2个“的形成,往往意味着市场反转。

2012/08/28

日経平均日足回顧・2手ツツミは最近の危険信号

Reminding NIKKEI 225 Daily. The recent continuance of two “TSUTSUMI” formations often implies the market reversal.

提醒日经225指数报。最近持续了”包围2个“的形成,往往意味着市场反转。


本日は日経平均日足についてです。

Today’s analyze is NIKKEI 225 daily.


ツツミ線は「天底の表示と知れ」とあります。

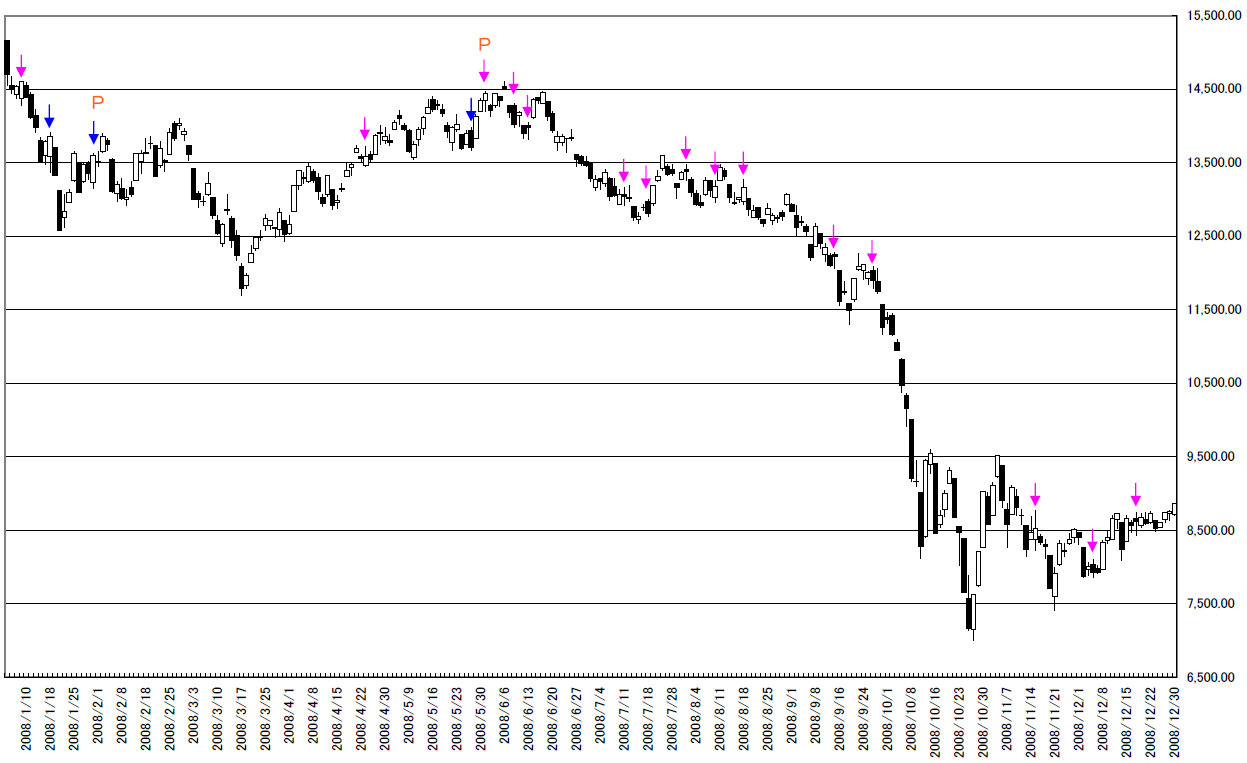
最近のチャートを見ていてツツミ線が気になったのでお知らせします。

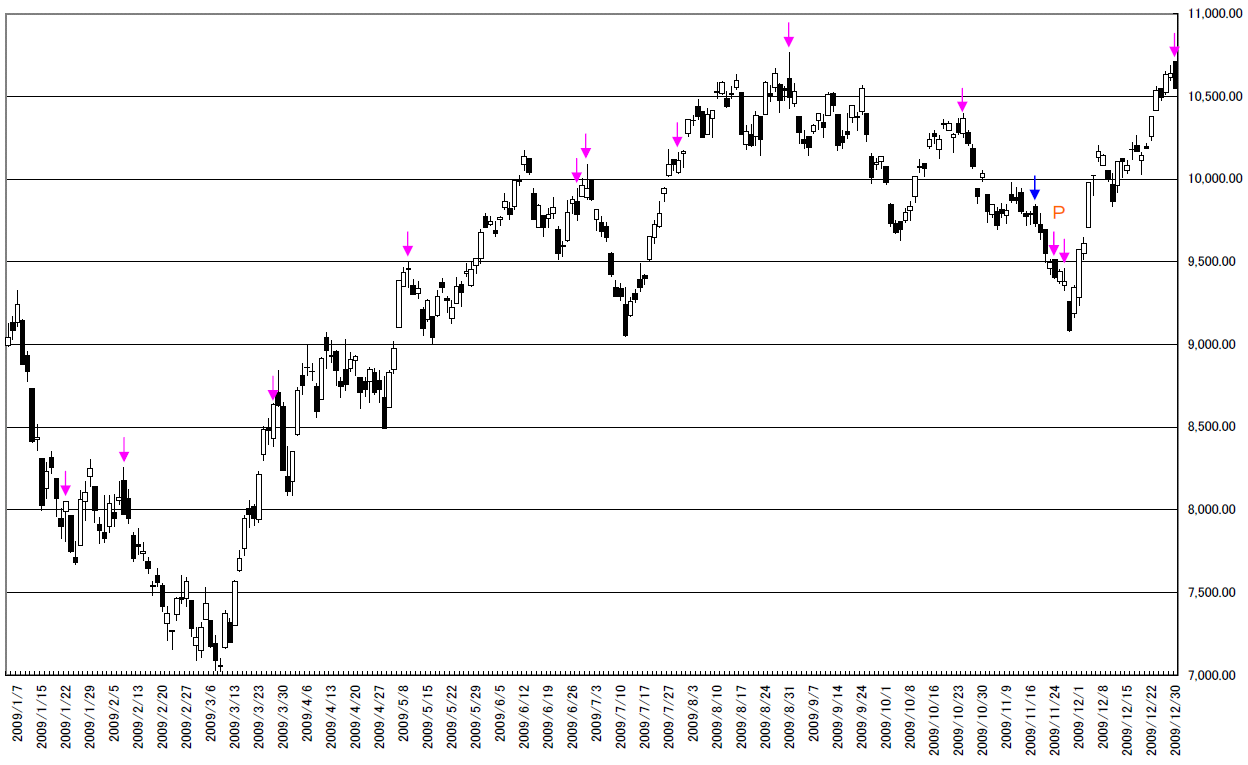
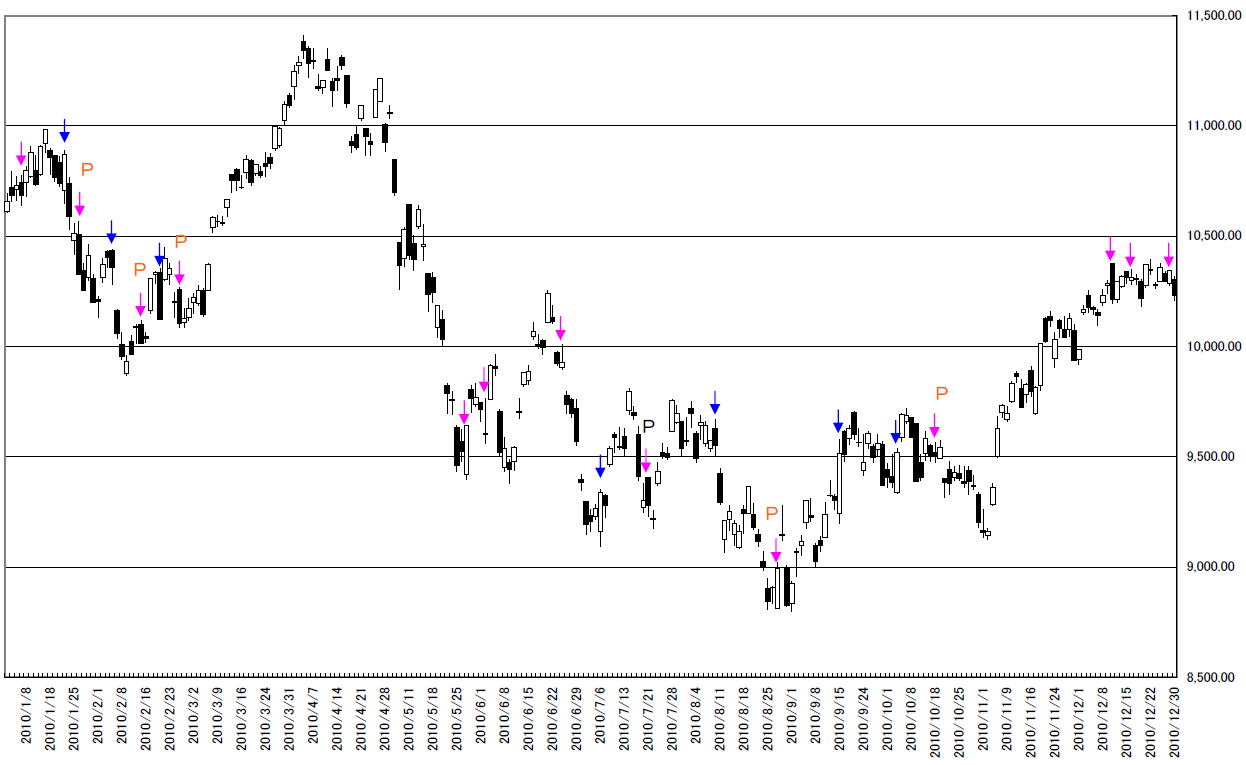
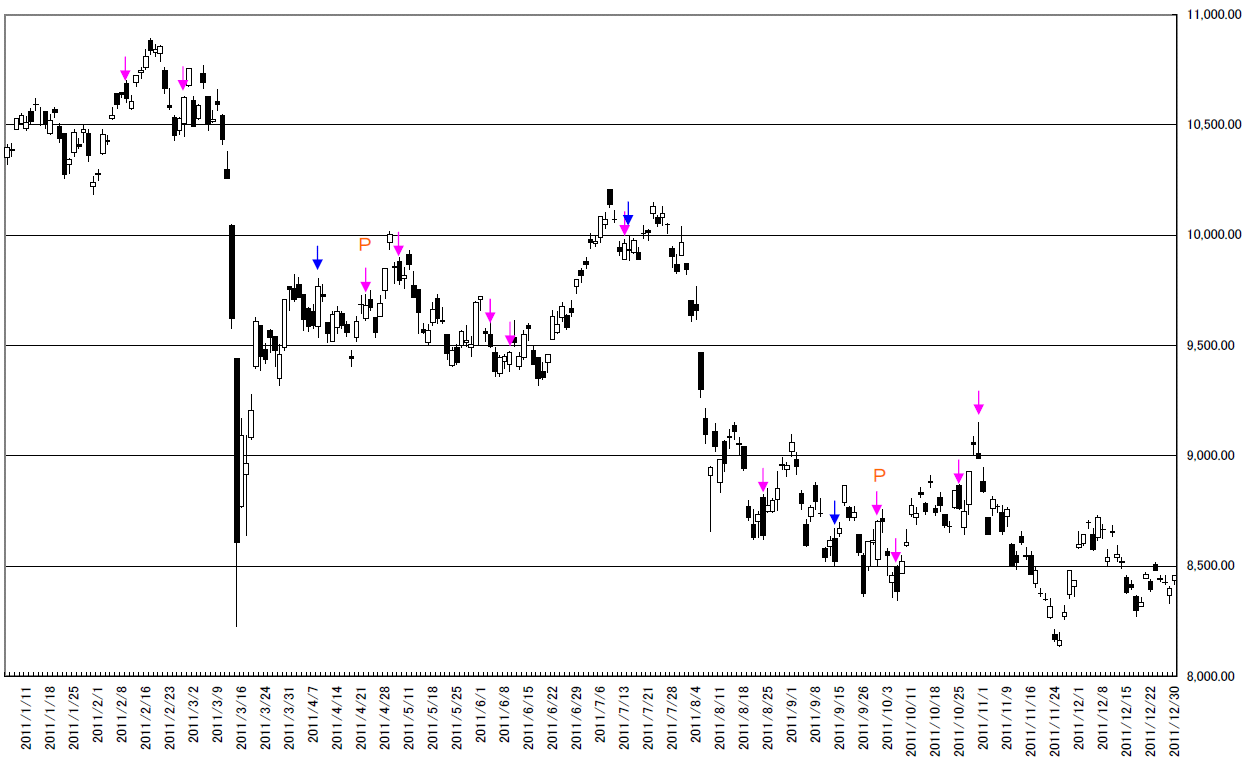
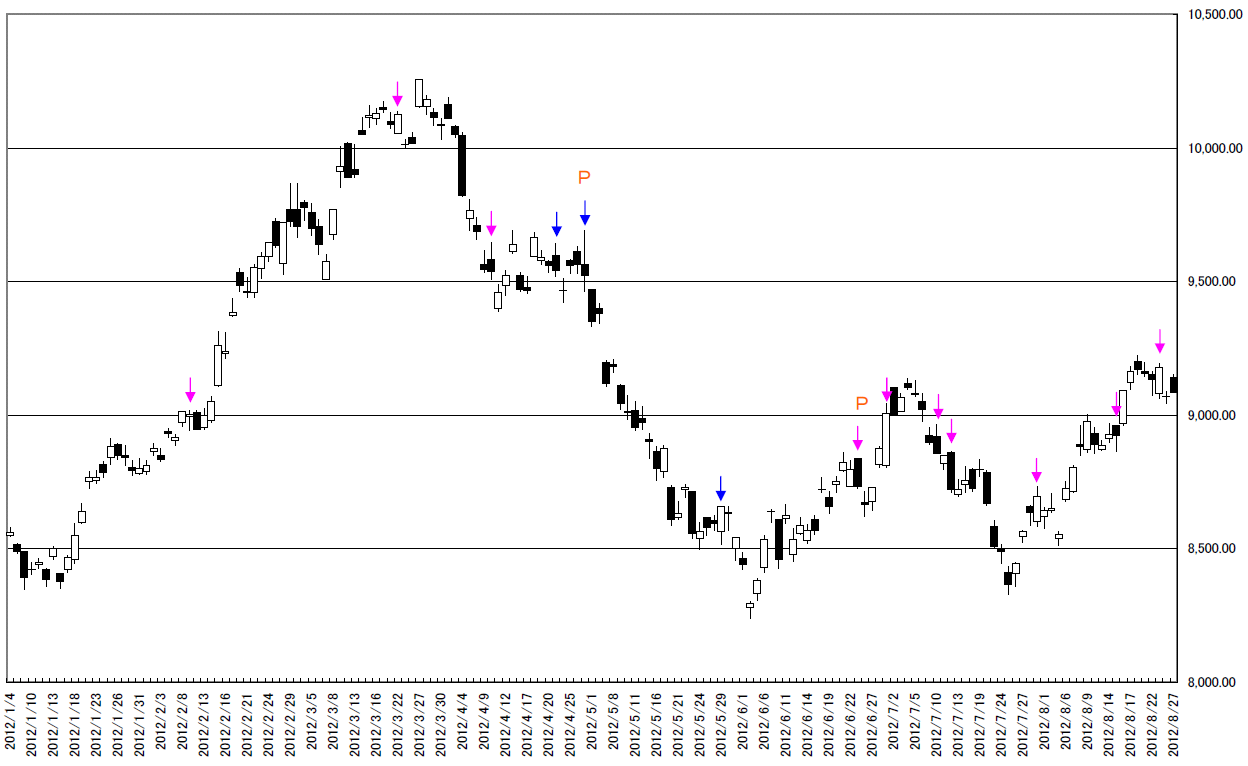
2手のツツミ線を青、1手のツツミ線をピンクとしました。

2手を包んだ足の次のツツミ足に「P」のマークをつけました。

トレンド転換を察知するシグナルになっていると感じますがいかがでしょうか?

1年に2-3回の出来事なので注意してみたいと思います。

The “SAKATA” says “TSUTSUMI” formation often implies the peak or bottom.

(“TSUTSUMI” means the market high-to-low price includes last day high-to-low price.)

We analyze the recent “TSUTSUMI” formations and found some.

We point out two days including candle stick is blue and one day including candle stick is pink.

After appearing two days including candle stick, we point out the next one or two days as “P”.

This often implies trend changing point.

Since this is 2 or 3 times of occurrences in a year, we need to be careful in it.


2008
2008


2009

2009


2010

2010


2011

2011


2012

2012


相場分析のリクエストがありましたら“Contact Us”からお知らせください。ご要望にお応えできるように努力いたします。

このブログはあくまでも個人的な見解であり、投資判断は各自でお願い致します。当ブログは一切の投資損益に対する責任を負いません。

ホームページに来て下さってありがとうございます。明日もよろしくお願いいたします。

If you have some request to analyze, please write to “Contact Us”.

We do best effort for your request.

These are only personal opinions on this blog, and you need the investment judgment in each one. This blog doesn’t assume the responsibility to all the investment profit and loss.

Thank for watching our contents. My best regards next day.
豪ドル円・上値追いの相場は終了/AUDJPY; We think the rally market may be finished./澳元日元。高出以前的价格追的行情结束。

2012/08/27

豪ドル円・上値追いの相場は終了

AUDJPY; We think the rally market may be finished.

澳元日元。高出以前的价格追的行情结束。


豪ドル円についてです。

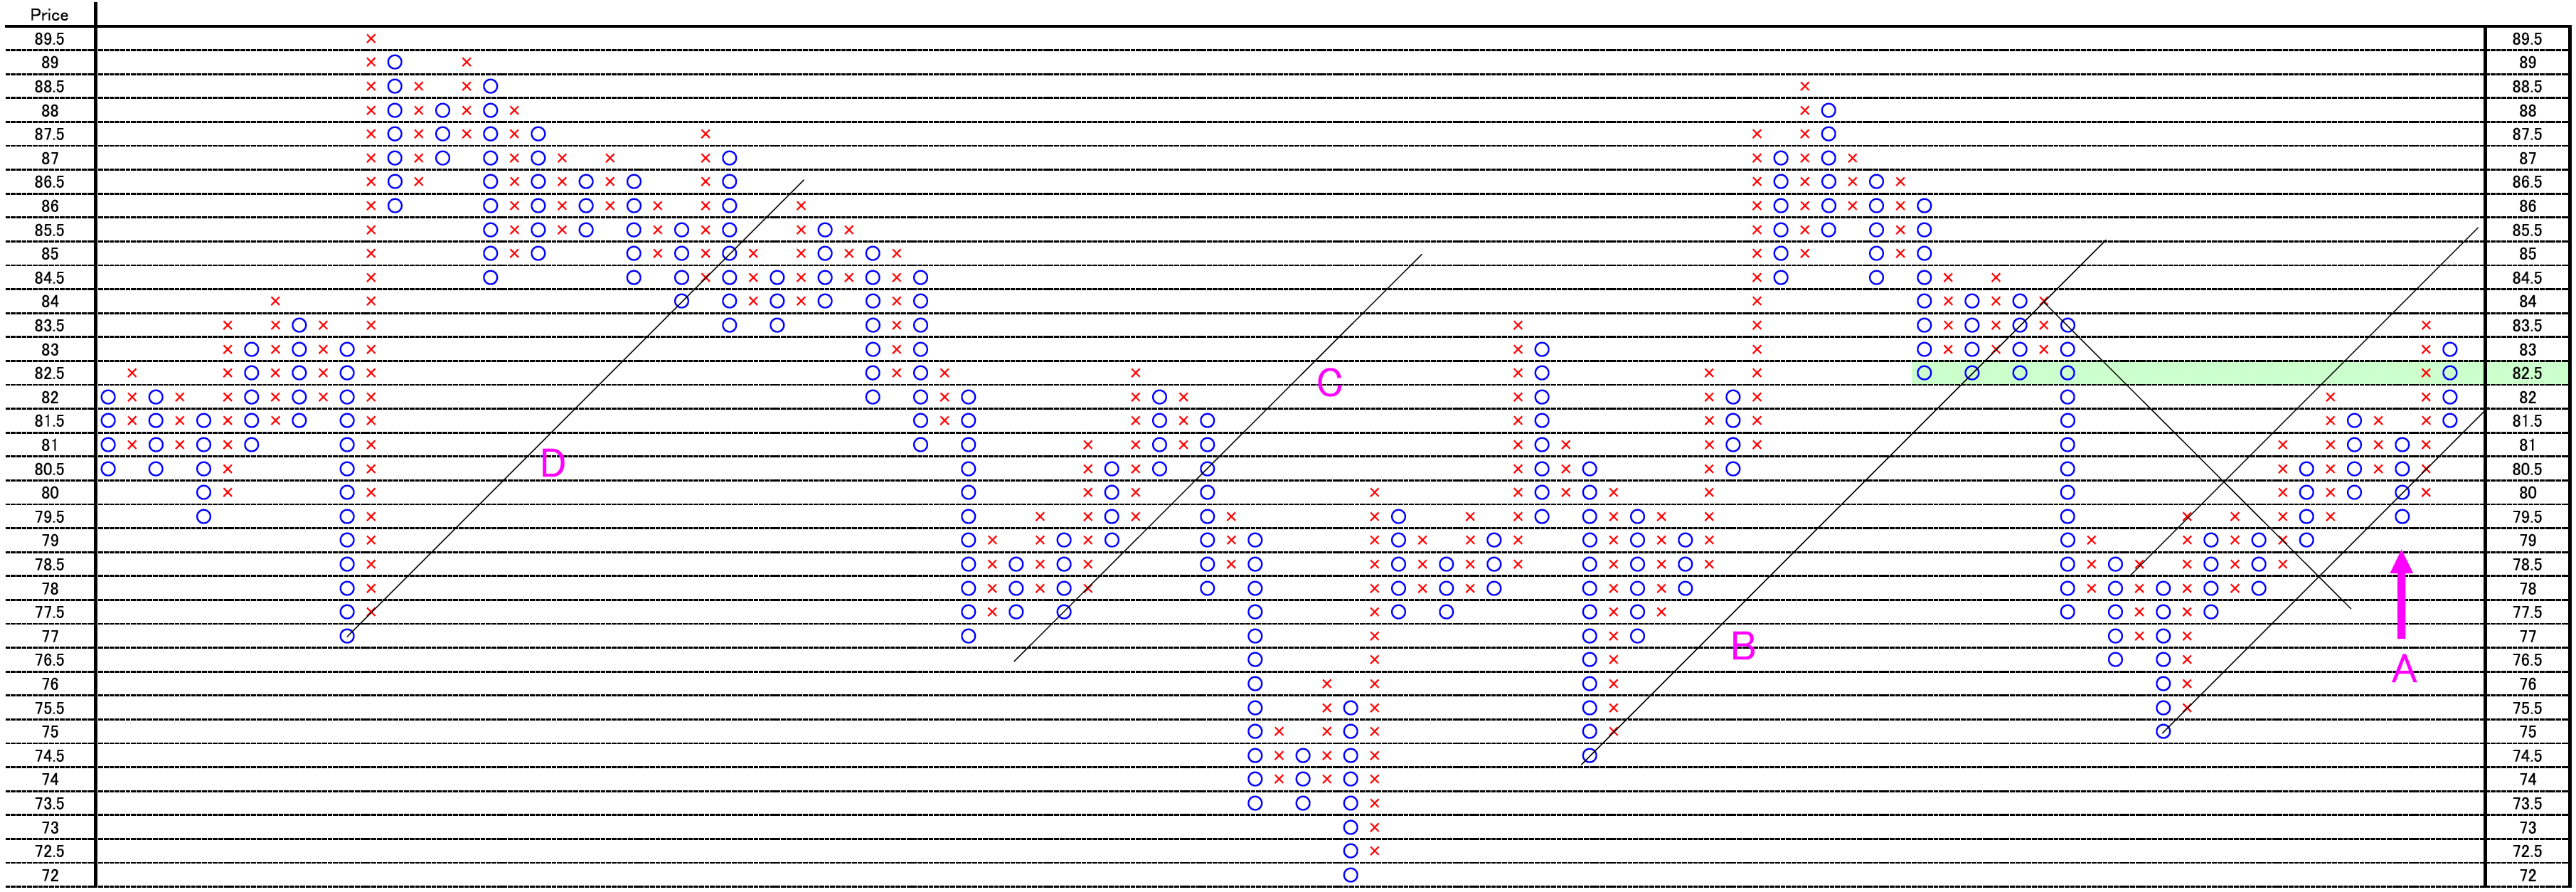
1枠0.5円、3枠転換の終値ポイントアンドフィギュアです。

マザーマーケットなのですが、オセアニア時間を抜いて書いています。

理由は分析の精度を高めるためなのですが、考えてみれば、マーケットの厚みの出る時間帯は東京時間帯中の出来事であることも影響していると考えられます。

This is AUDJPY chart.

This is 0.5 price change and 3 box reversal close price’s Point and Figure chart.

This currency pairs contain mother market but we withdraw them.

The reason why is improving the analysis and this may effect on the liquidity problem.

PF


A点で45度線を割り込んできています。

過去にも45度線を割り込むと下落する事例が多発しており、LONGは手仕舞いしておいた方が良さそうです。

The market price cut 45 degree support level.

There were many cases the market price fall when the price cut 45 degree resistance line; we think we may need to close long position.


相場分析のリクエストがありましたら“Contact Us”からお知らせください。ご要望にお応えできるように努力いたします。

このブログはあくまでも個人的な見解であり、投資判断は各自でお願い致します。当ブログは一切の投資損益に対する責任を負いません。

ホームページに来て下さってありがとうございます。明日もよろしくお願いいたします。

If you have some request to analyze, please write to “Contact Us”.

We do best effort for your request.

These are only personal opinions on this blog, and you need the investment judgment in each one. This blog doesn’t assume the responsibility to all the investment profit and loss.

Thank for watching our contents. My best regards next day.

© 2026 Retar