
東京円建て金日足・もう1手高値引けを見てから上昇トレンド入りを確認/Tokyo market gold; if the market will become next closing high, we can confirm now is the bullish./东京市场的黄金市场。如果会再以一次高价结束如果做,进入上升倾向。

2012/08/21

東京円建て金日足・もう1手高値引けを見てから上昇トレンド入りを確認

Tokyo market gold; if the market will become next closing high, we can confirm now is the bullish.

东京市场的黄金市场。如果会再以一次高价结束如果做,进入上升倾向。


本日は東京円建て金日足を分析します。

Today we analyze Tokyo market gold calculated in yen (Daily Data).


2012/07/27のレポートでは高値引けの特徴を説明しました。

今回はデータをプログラムでフィルタリングして、高値引けに矢印をつけてみました。

緑はヒゲなし、紫は高値引けです。

2012/08/17は久しぶりの高値引けですが、今のところ後が続いておりません。

相場初期に2手目を見てから強気転換となっても遅すぎないと思います。

もうひとつは、4183ポイントを大陽線で抜くような動きになると上昇トレンドははっきりしたものになると考えております。

We introduce “Closing high” unique character in 07/27/2012.

Today, we filter “Closing high” points and put arrows on the chart.

The green and purple points are “Closing high” points.

08/17/2012 became close high in quite a while and it did not follow.

Until we see next closing high, we do not become bullish.

In other view, if the market price will go over 4183 point in a day, this will also suggest real bullish trend.
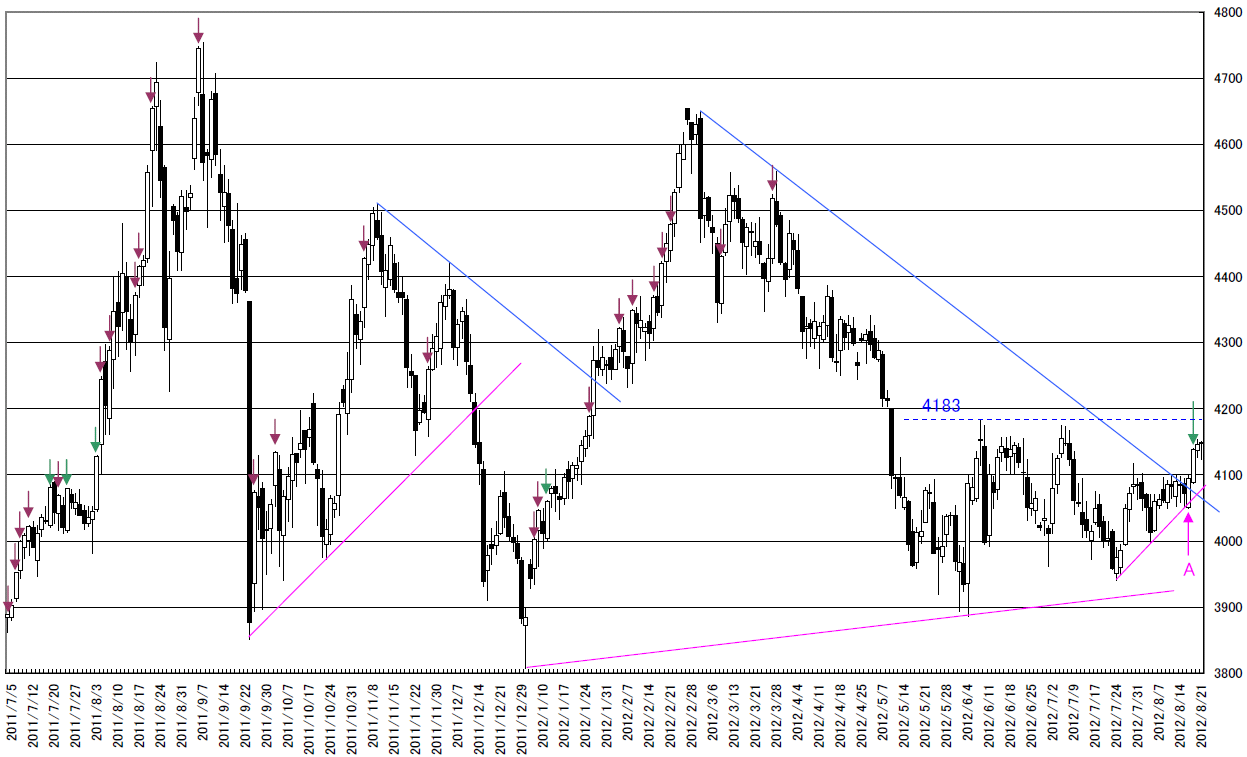
CHART


相場分析のリクエストがありましたら“Contact Us”からお知らせください。ご要望にお応えできるように努力いたします。

このブログはあくまでも個人的な見解であり、投資判断は各自でお願い致します。当ブログは一切の投資損益に対する責任を負いません。

ホームページに来て下さってありがとうございます。明日もよろしくお願いいたします。

If you have some request to analyze, please write to “Contact Us”.

We do best effort for your request.

These are only personal opinions on this blog, and you need the investment judgment in each one. This blog doesn’t assume the responsibility to all the investment profit and loss.

Thank for watching our contents. My best regards next day.
日経平均日足・9250円と9650円に抵抗帯/NIKKEI 225 Daily. There are resistance points 9250yen and 9650yen./日经平均。9250日元和9650日元反抗带。

2012/08/20

日経平均日足・9250円と9650円に抵抗帯

NIKKEI 225 Daily. There are resistance points 9250yen and 9650yen.

日经平均。9250日元和9650日元反抗带。


本日は日経平均日足についてです。

Today’s analyze is NIKKEI 225 daily.


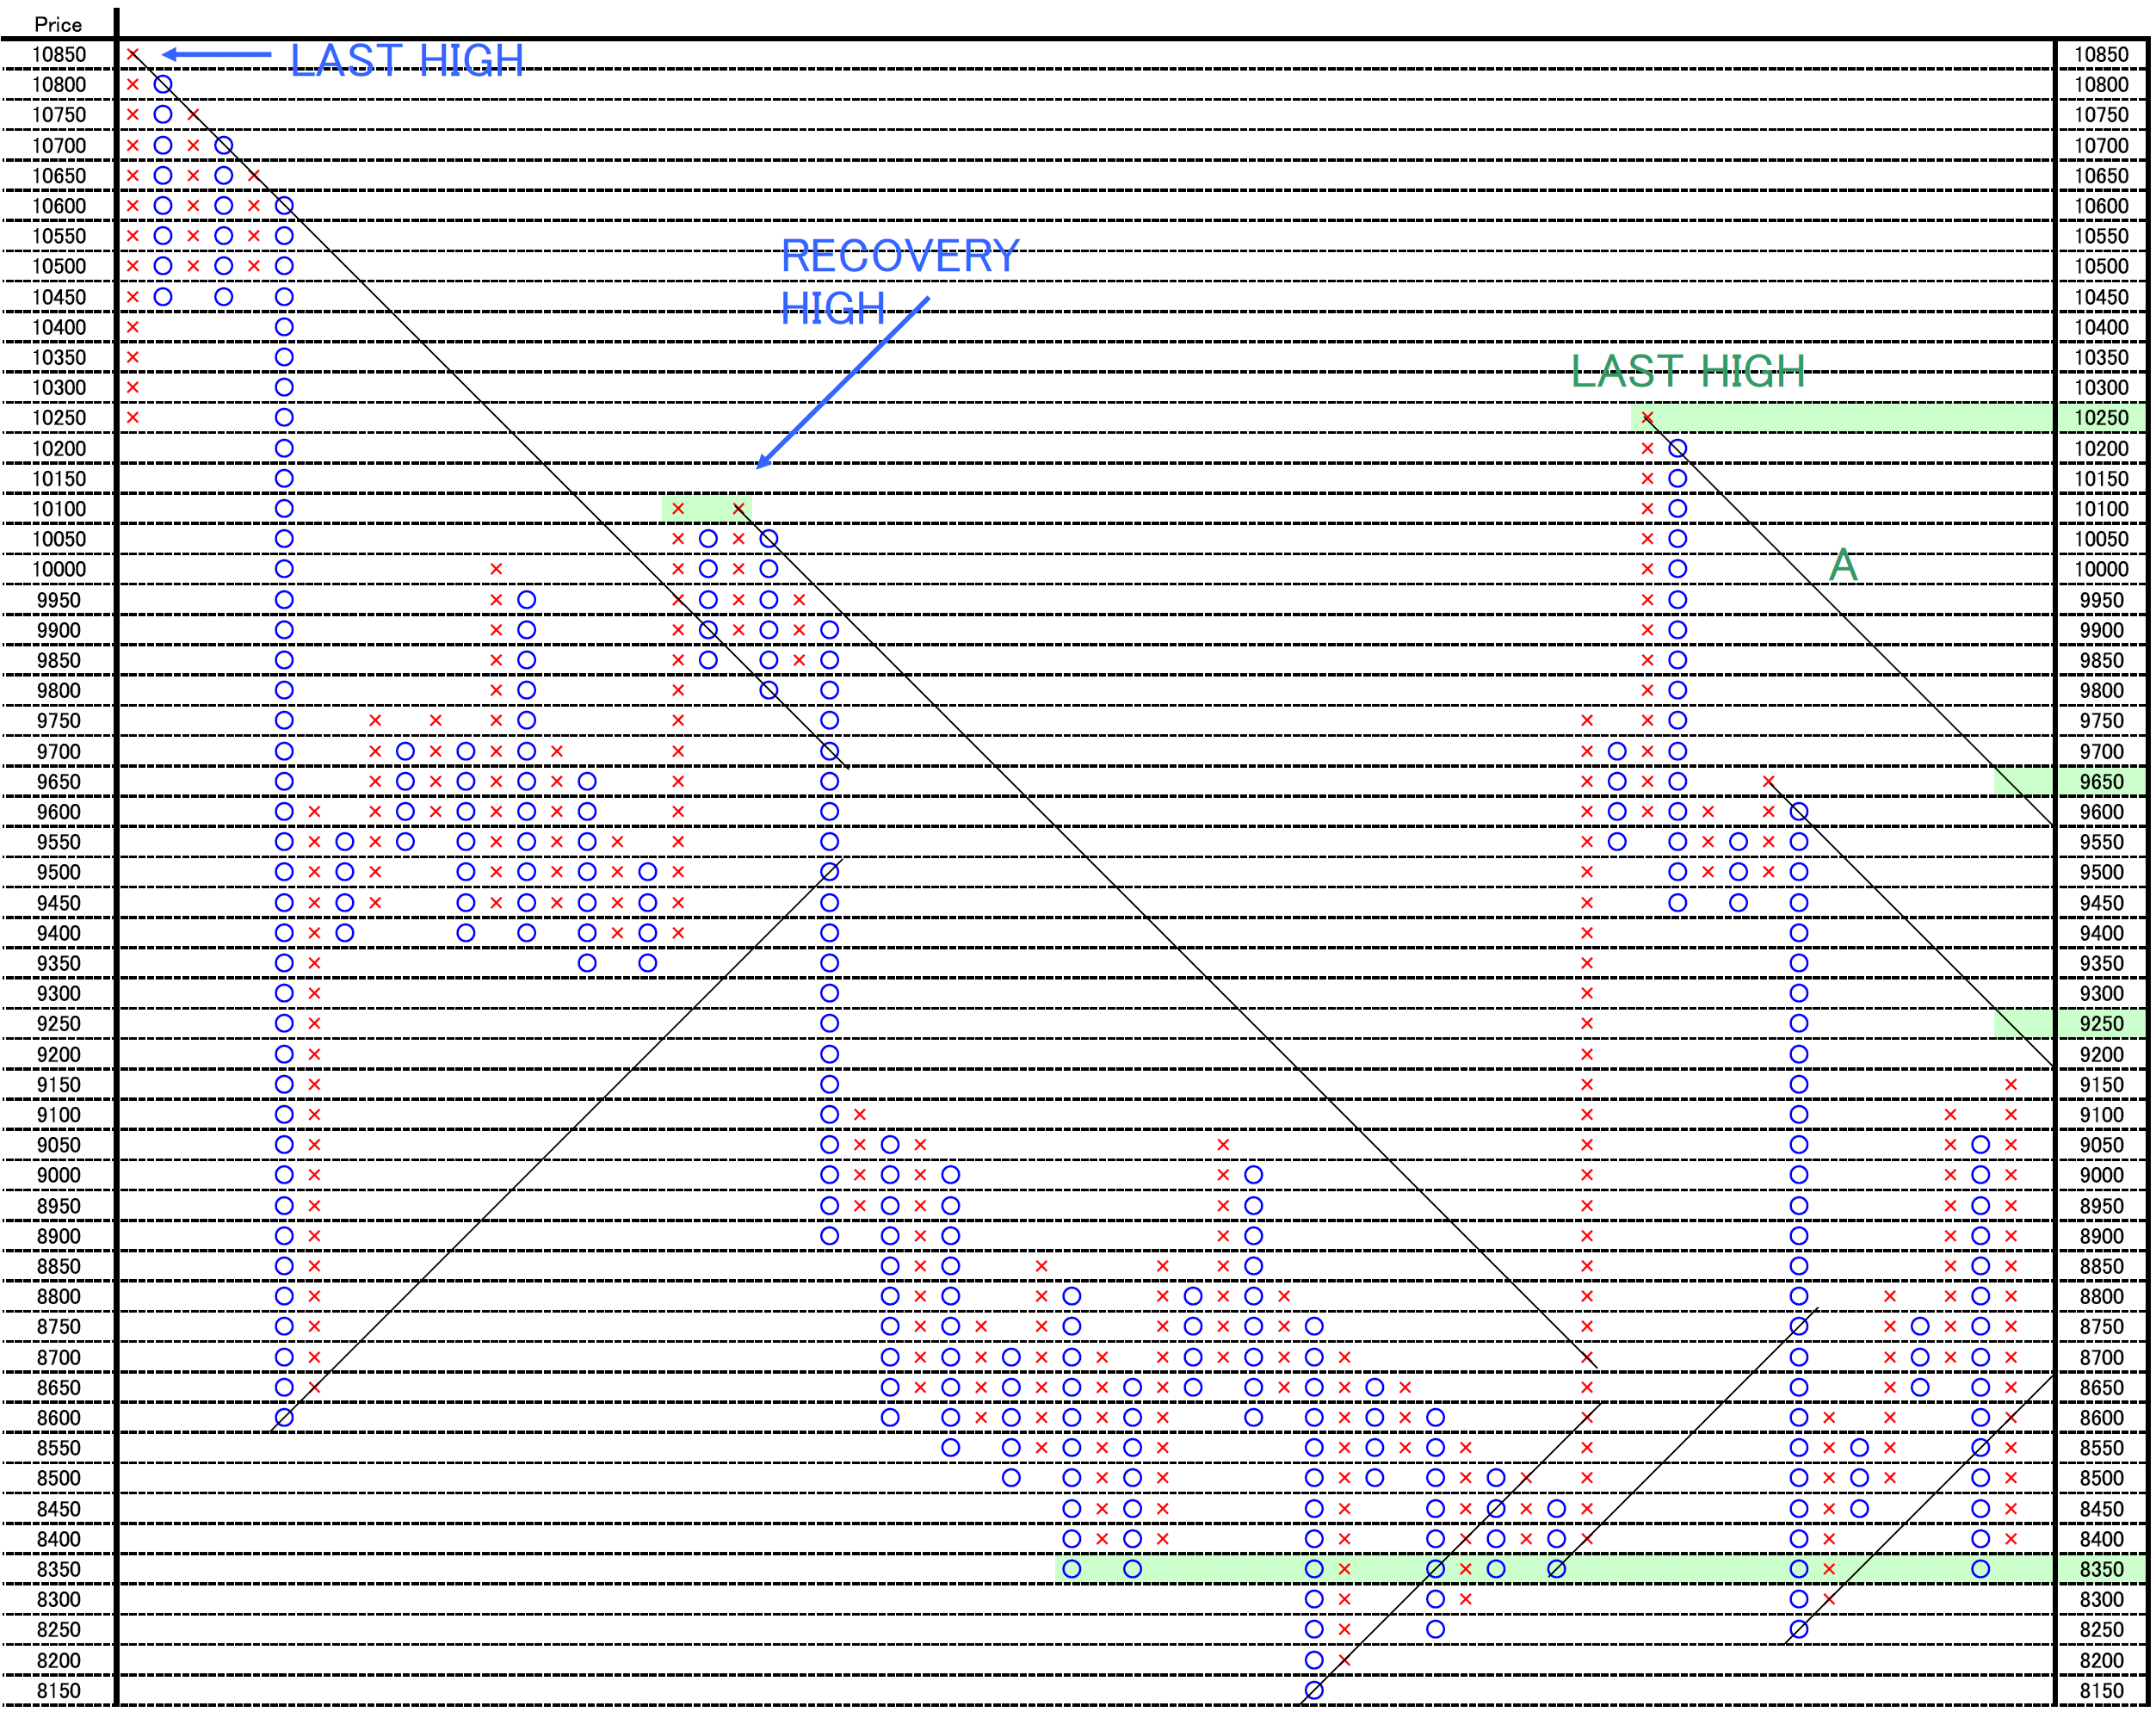
1枠50ポイント、3枠転換の終値ポイントアンドフィギュアです。

2012/07/11のレポートの通り「2012/03/27高値が重要高値なら7750-7550円視野」という見方に変わりありません。

考えた方が変える条件は10200円を超えたときです。

今後「A」のレジスタンスを抜く局面があるかもしれませんが、前回のように失速することもあるので注意が必要です。

直近のレジスタンスは9250円と9650円にあります。

This is 50point change and 3 box reversal close price’s Point and Figure chart.

Our view has not changed from 07/11/2012; if 03/27/2012 high price may be a major high, the target price may become 7750-7550 yen.

If the market close price will go 10200 yen over, our view will change.

The market price may go over “Resistance A”, but market price may fall again.

PF


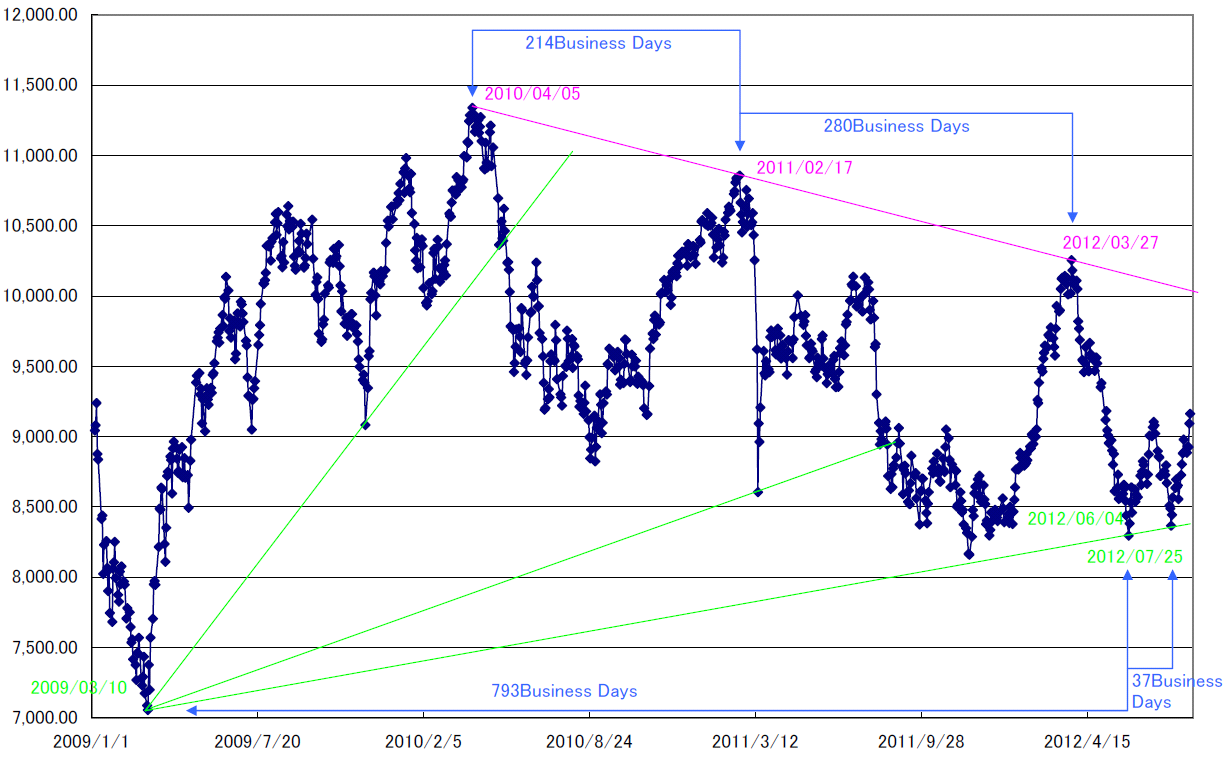
2012/06/27レポートで、日経の上値を押さえ込んだトレンドラインを紹介しました。

今回は日足終値に同じ線を引きました。

年初来高値が一直線に並んでいることはとても意味のある線だと紹介しました。

そして、今回は2009/03/10と2012/06/04と2012/07/25がほぼ一直線に並んでいることも紹介したいと思います。(緑一番下のサポート)

これが日柄の尻尾かもしれません。

In 06/27/2012 report, we analyze the NIKKEI 225 resistance line.

We added this on daily chart.

We introduced this line is very meaningful; these points are lining.

And today, we introduce 03/10/2009, 06/04/2012 and 07/25/2012 are almost lining. (See outside green line.)

This may suggest “HIGARA” tail.

CHART


相場分析のリクエストがありましたら“Contact Us”からお知らせください。ご要望にお応えできるように努力いたします。

このブログはあくまでも個人的な見解であり、投資判断は各自でお願い致します。当ブログは一切の投資損益に対する責任を負いません。

ホームページに来て下さってありがとうございます。明日もよろしくお願いいたします。

If you have some request to analyze, please write to “Contact Us”.

We do best effort for your request.

These are only personal opinions on this blog, and you need the investment judgment in each one. This blog doesn’t assume the responsibility to all the investment profit and loss.

Thank for watching our contents. My best regards next day.
© 2026 Retar
