
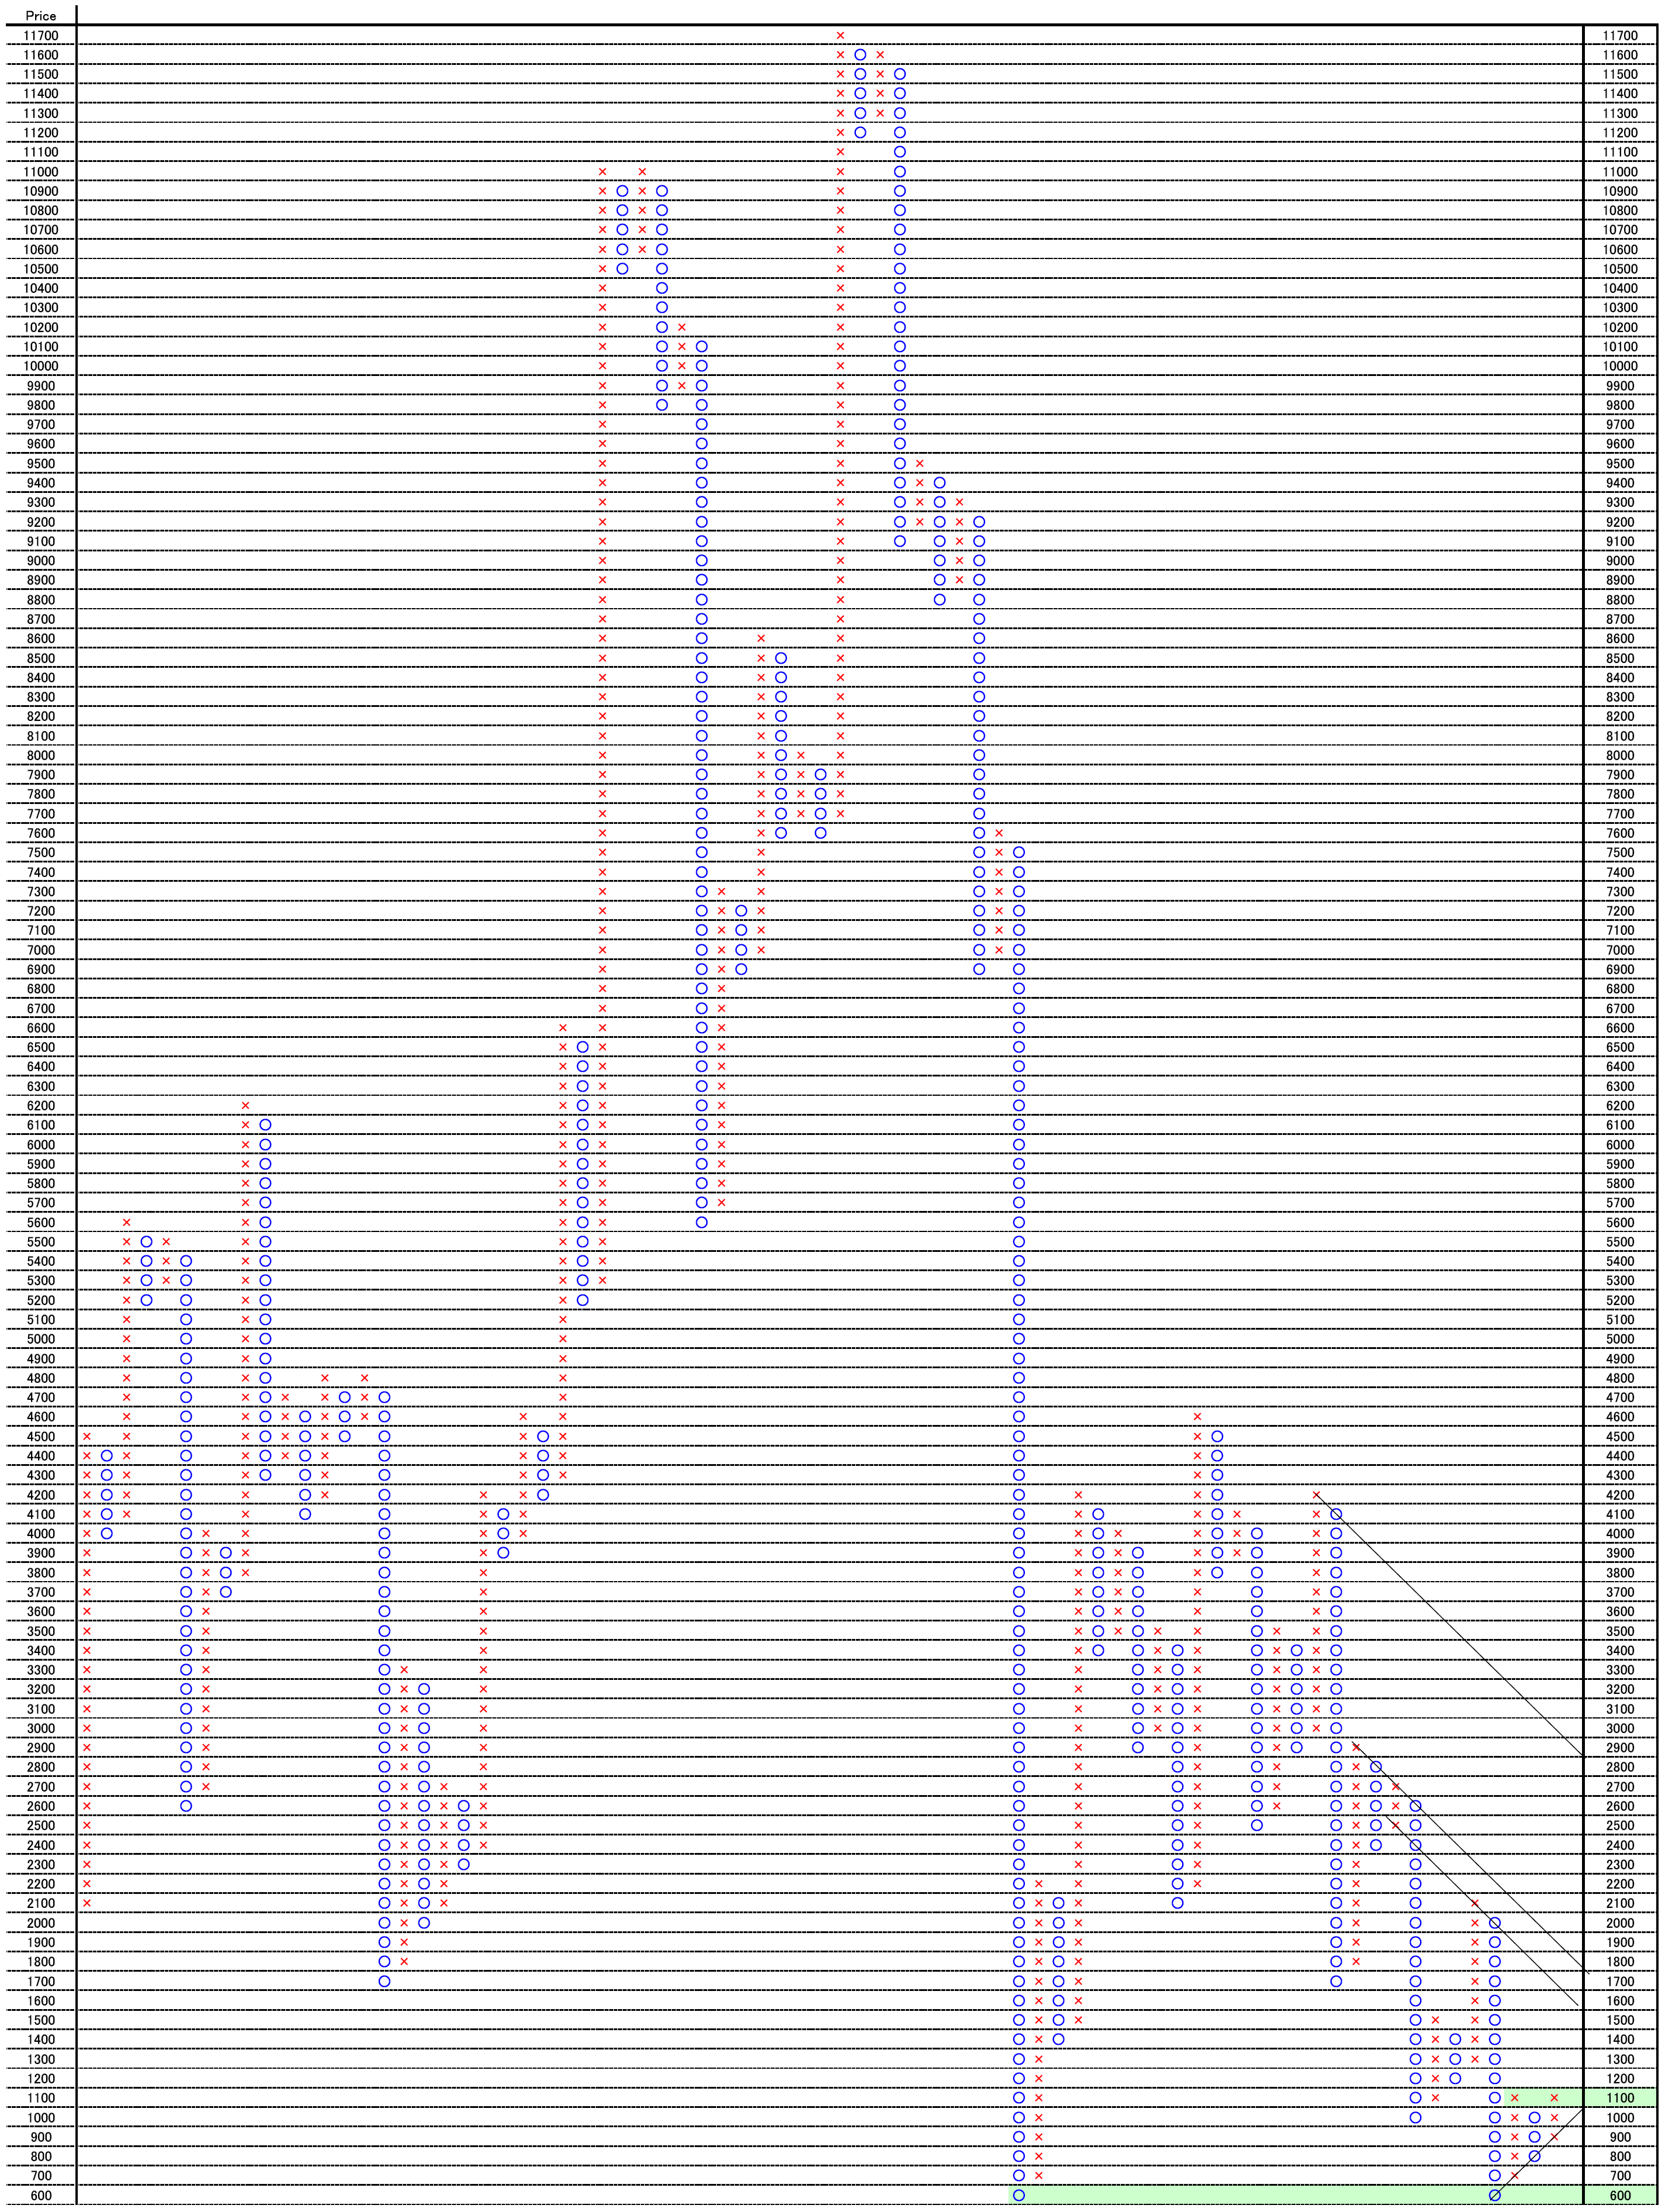
バルチック海運指数600ポイントと1100ポイントに抵抗帯/We can see resistance and support at 600 point and 1100 point in Baltic Dry Index Daily./为波罗的海运指数600点和1100点反抗带。

2012/08/01

バルチック海運指数600ポイントと1100ポイントに抵抗帯

We can see resistance and support at 600 point and 1100 point in Baltic Dry Index Daily.

为波罗的海运指数600点和1100点反抗带。


本日はバルチック海運指数日足を分析しました。

Today’s analyze is Baltic Dry Index Daily.


1枠100pt、3枠転換の終値ポイントアンドフィギュアです。

2003年5月から本日までのデータで作成しています。

上方にダブルトップ、下方にダブルボトムを形成しています。

セオリーでは下方サポートは離れになっているため、600ポイントの方が強いサポートになっています。

This is 100pt change and 3 box reversal close price’s Point and Figure chart.

We plot it from 05/2003 to today’s data.

The market price formed double top and double bottom.

In the theory, the bottom price takes more distance; this is stronger than upper side resistance.
100


1枠10pt、3枠転換の終値ポイントアンドフィギュアです。

直近の相場を拡大してみました。

1160ポイントでダブルトップをつけています。

1160ポイント超えは今後の相場の転換点になってもおかしくありません。

注意して見ていきたいと思います。

This is 10pt change and 3 box reversal close price’s Point and Figure chart and plotted the recent market.

The market price formed double top at 1160point.

When the market price will go over 1160point, this may become the market trend reversal.

We need to watch the market carefully,

10


相場分析のリクエストがありましたら“Contact Us”からお知らせください。ご要望にお応えできるように努力いたします。

このブログはあくまでも個人的な見解であり、投資判断は各自でお願い致します。当ブログは一切の投資損益に対する責任を負いません。

ホームページに来て下さってありがとうございます。明日もよろしくお願いいたします。

If you have some request to analyze, please write to “Contact Us”.

We do best effort for your request.

These are only personal opinions on this blog, and you need the investment judgment in each one. This blog doesn’t assume the responsibility to all the investment profit and loss.

Thank for watching our contents. My best regards next day.
シカゴ・オプションVIX(恐怖心理指数)日足に危機発生注意パターン継続/The caution pattern is still going on Chicago Options: ^VIX Daily./ 为芝加哥·选项VIX(恐怖心理指数)危机发生注意图形继续危机发生注意。

2012/07/31

シカゴ・オプションVIX(恐怖心理指数)日足に危機発生注意パターン継続

The caution pattern is still going on Chicago Options: ^VIX Daily.

为芝加哥·选项VIX(恐怖心理指数)危机发生注意图形继续危机发生注意。


本日はシカゴ・オプションVIX(恐怖心理指数)日足についてです。

Today, we analyze Chicago Options: ^VIX Daily data.


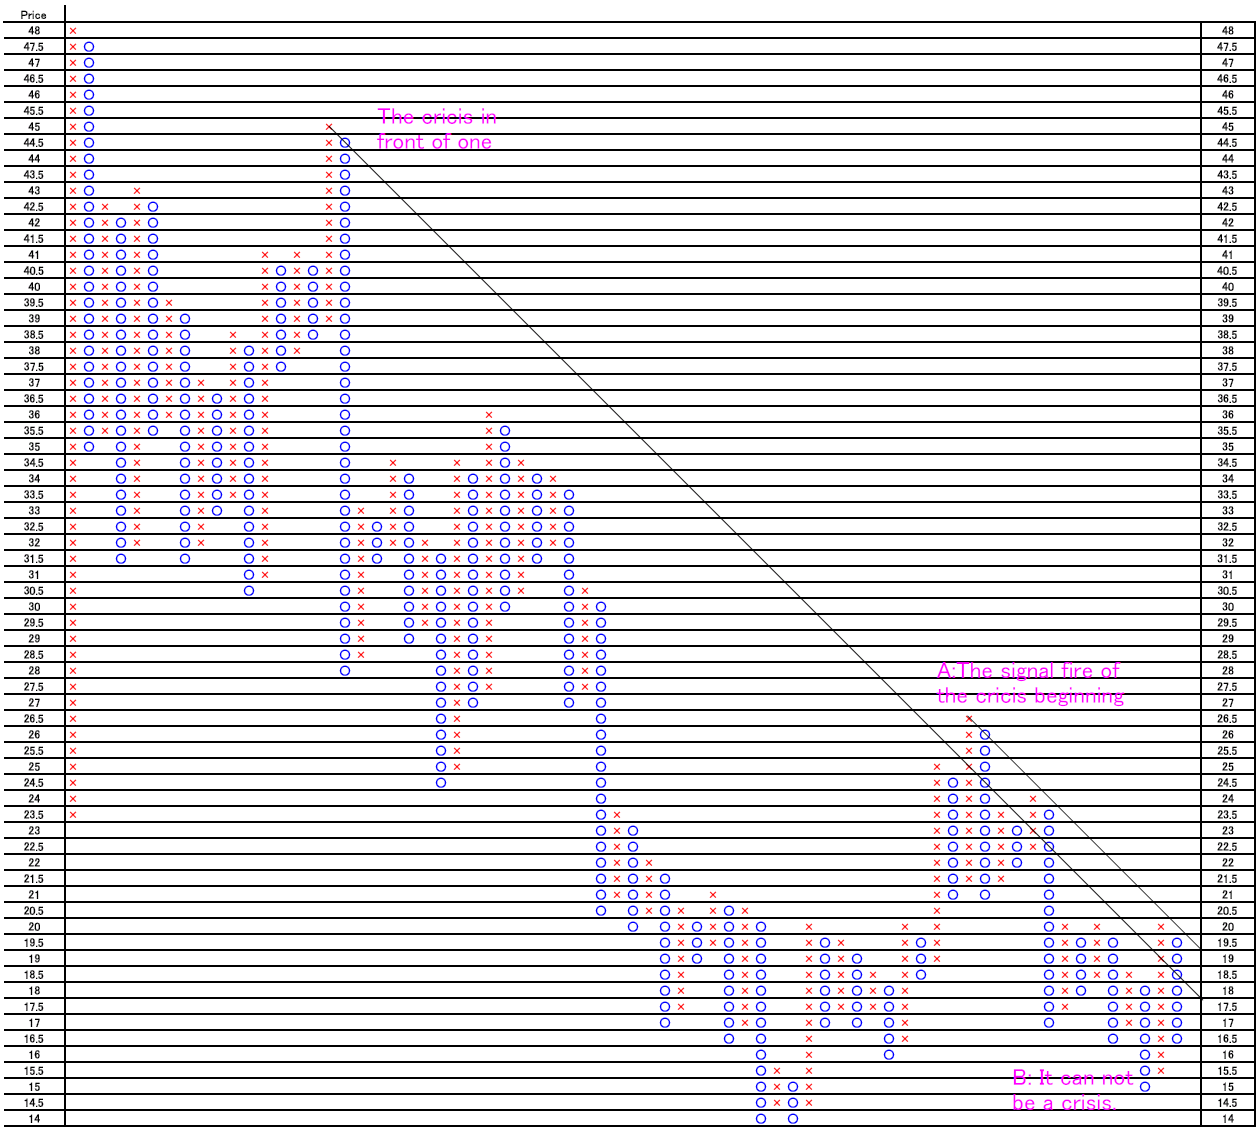
2012/03/27の私たちの分析では、VIXの大きな上昇時には、一定のパターンが見受けられるということを分析しました。

特徴をまとめると以下のようになります。

1. 前回高値からの45度線を超える。

2. A地点で高値を取って何事もなかったかのようにB地点まで下げる

3. A地点からの45度線を抜けて危機が始まる(C地点)

3回の危機は同じパターンでした。

In our 03/27/2012 report, we analyze there is a same pattern when the VIX index jump.

The features are following.

1. The first, the market price cuts 45 degree resistance line from the last crisis.

2. The market price takes a peak “A”, and falls to “B” point as if there was nothing occasion.

3. The market price cuts 45 degree resistance line from “A” point, and the crisis is starting.

These 3 crises occur in same pattern.

PF


現在の相場は、フェーズ2付近にいます。

2012/07/19には15.45ポイントまで下げており、過去の危機発生直前の下限付近の値に十分到達していると考えております。

予測不可能なことが発生するかもしれません。

十分注意をして相場に臨みたいと思います。

The recent market comes into “Phase 2”.

The recent lowest point was 15.45point in 07/19/2012 and this is almost close to the past bottom price.

An unpredictable thing may occur.

We are careful enough to face the market.


相場分析のリクエストがありましたら“Contact Us”からお知らせください。ご要望にお応えできるように努力いたします。

このブログはあくまでも個人的な見解であり、投資判断は各自でお願い致します。当ブログは一切の投資損益に対する責任を負いません。

ホームページに来て下さってありがとうございます。明日もよろしくお願いいたします。

If you have some request to analyze, please write to “Contact Us”.

We do best effort for your request.

These are only personal opinions on this blog, and you need the investment judgment in each one. This blog doesn’t assume the responsibility to all the investment profit and loss.

Thank for watching our contents. My best regards next day.

© 2026 Retar