
日経平均日足・2012/03/27高値が重要高値なら7750-7550円視野/NIKKEI 225 Daily. If 03/27/2012 high price may be a major high, the target price may become 7750-7550 yen.

2012/07/11

本日は日経平均日足についてです。

Today’s analyze is NIKKEI 225 daily.


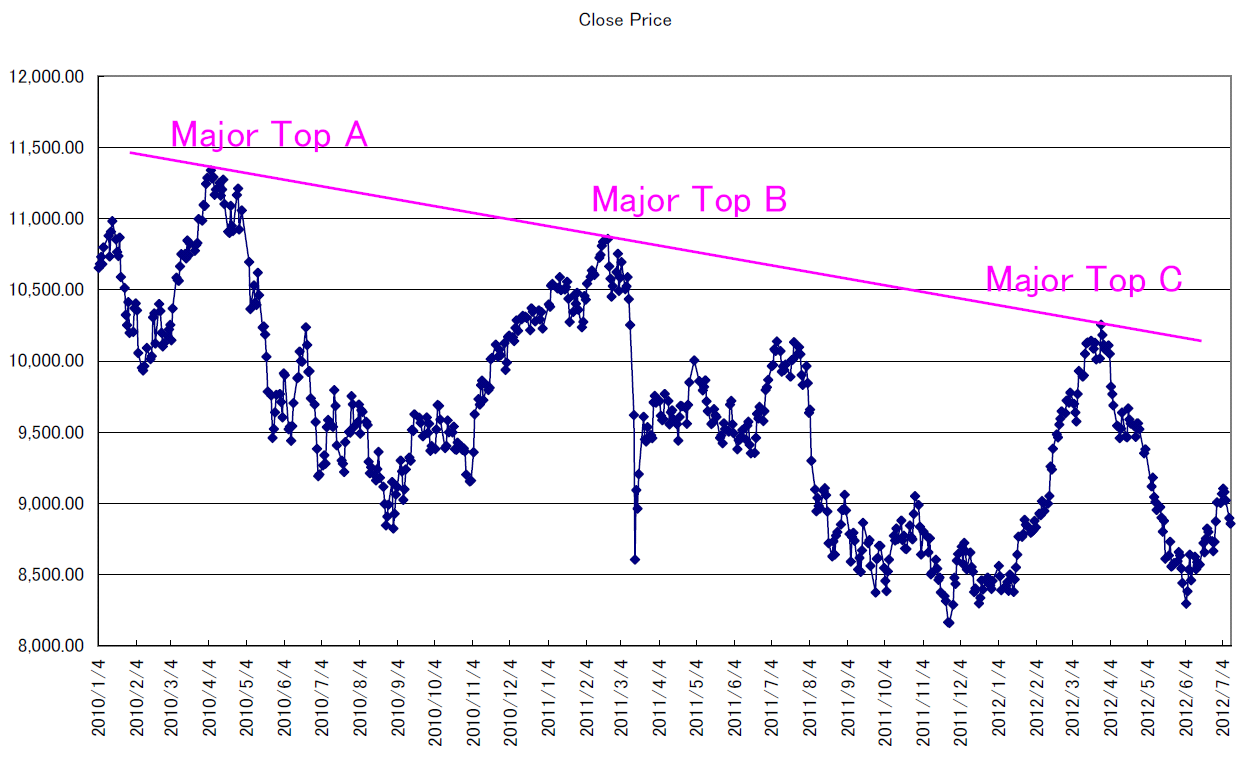
2012/06/27レポートで、日経の上値を押さえ込んだトレンドラインを紹介しました。

今回は日足終値に同じ線を引きました。

Major Top Aは2010/04/05、Major Top Bは2011/02/21、Major Top Cは2012/03/27です。

年初来高値が一直線に並んでいることはとても意味のある線だと思っております。

In 06/27/2012 report, we analyze the NIKKEI 225 resistance line.

We added this on daily chart.

“Major Top A” is 04/05/2010, “Major Top B” is 02/21/2011 and “Major Top C” is 03/27/2012.

We think this line is very meaningful; these points are lining.
CHART


次にそれぞれの点をポイントアンドフィギュアに示してみました。

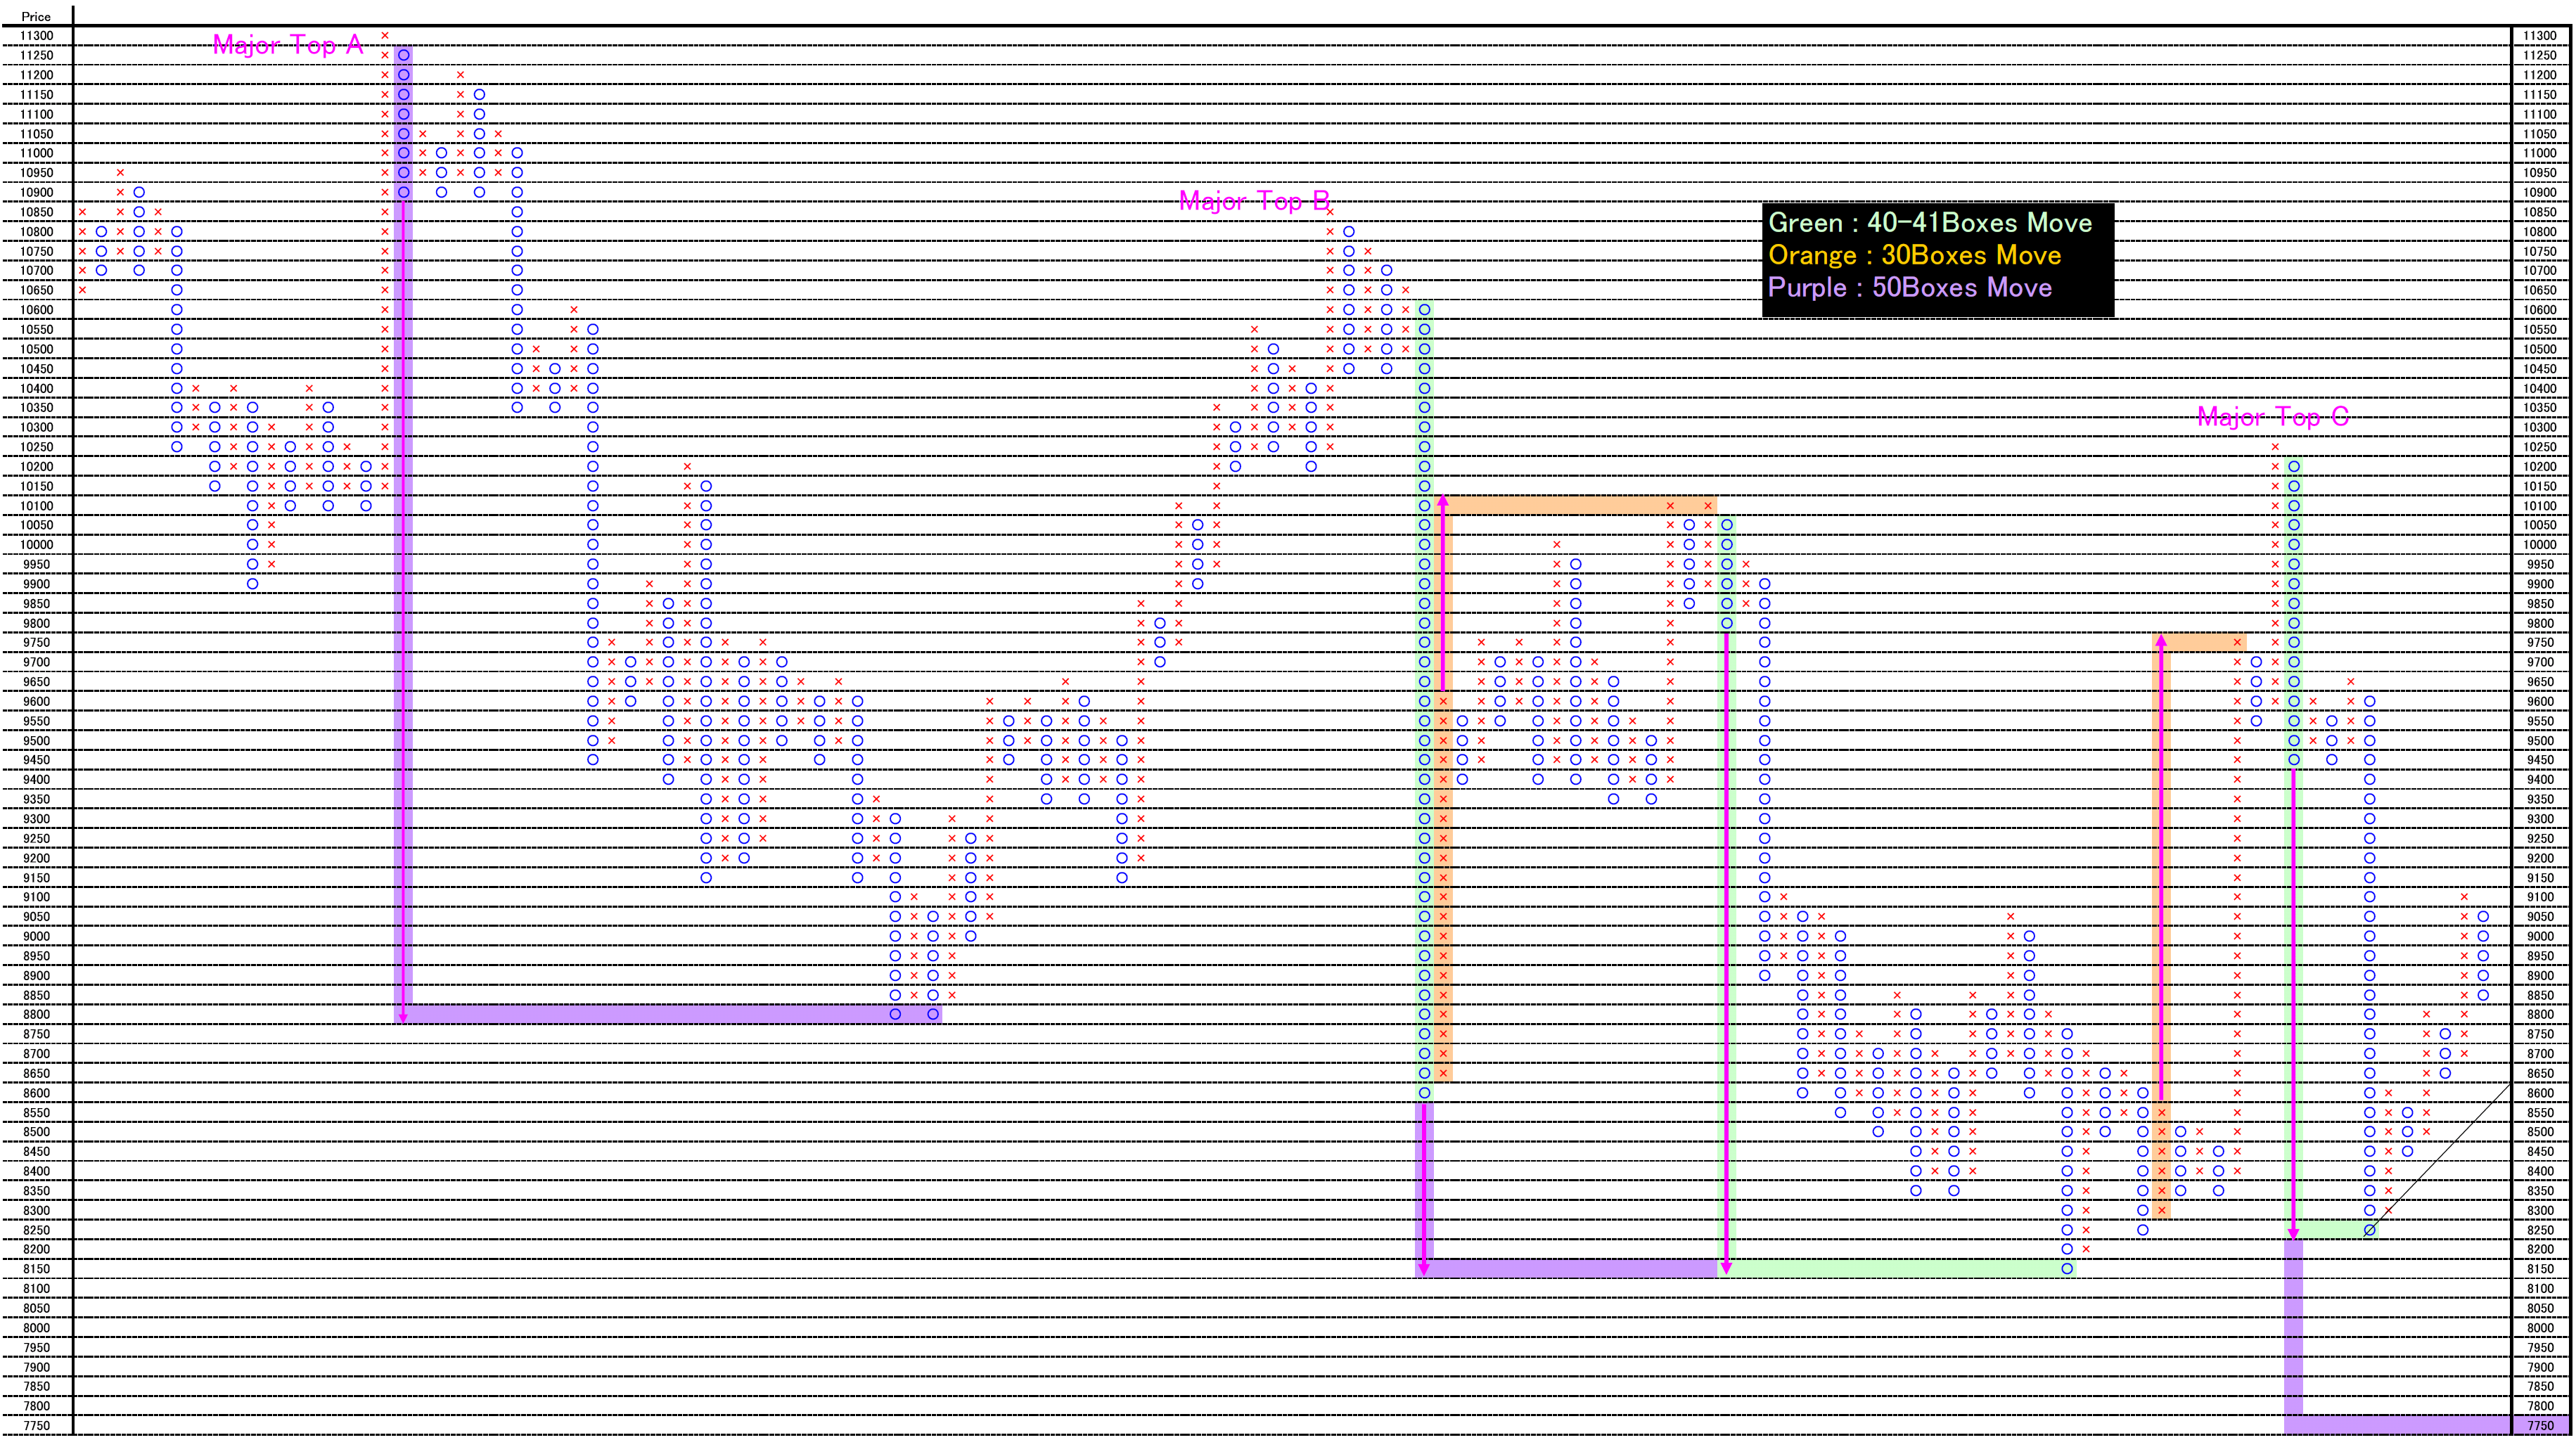
1枠50ポイント、3枠転換の終値ポイントアンドフィギュアです。

Major Top Aからは54枠の下落、Major Top Bからは50枠の下落となっております。

もし、Major Top Cが年初来高値となり、前例に従い下落(50枠-54枠の下落)するのであれば、ターゲットは7750-7550円前後となると思います。

And we add “Major” points on the P&F chart.

This is 50point change and 3 box reversal close price’s Point and Figure chart.

The fall from “Major Top A” is 54 boxes move and the fall from “Major Top B” is 50 boxes move.

If “Major Top C” will become year high and will follow the past market fall (This means 50-54 boxes fall), the target price will become 7750-7550 yen.
PF


相場分析のリクエストがありましたら“Contact Us”からお知らせください。ご要望にお応えできるように努力いたします。

このブログはあくまでも個人的な見解であり、投資判断は各自でお願い致します。当ブログは一切の投資損益に対する責任を負いません。

ホームページに来て下さってありがとうございます。明日もよろしくお願いいたします。

If you have some request to analyze, please write to “Contact Us”.

We do best effort for your request.

These are only personal opinions on this blog, and you need the investment judgment in each one. This blog doesn’t assume the responsibility to all the investment profit and loss.

Thank for watching our contents. My best regards next day.
ニューヨーク銀日足。パート3:1971-1974年相場をなぞるなら、どこかの時点で力強い上昇/ NY silver daily market. If the market price will follows from 1971 to 1974 market, the market price will jump up. Part 3.

2012/07/10

本日はNY銀を分析します。

Today we analyze NY silver.


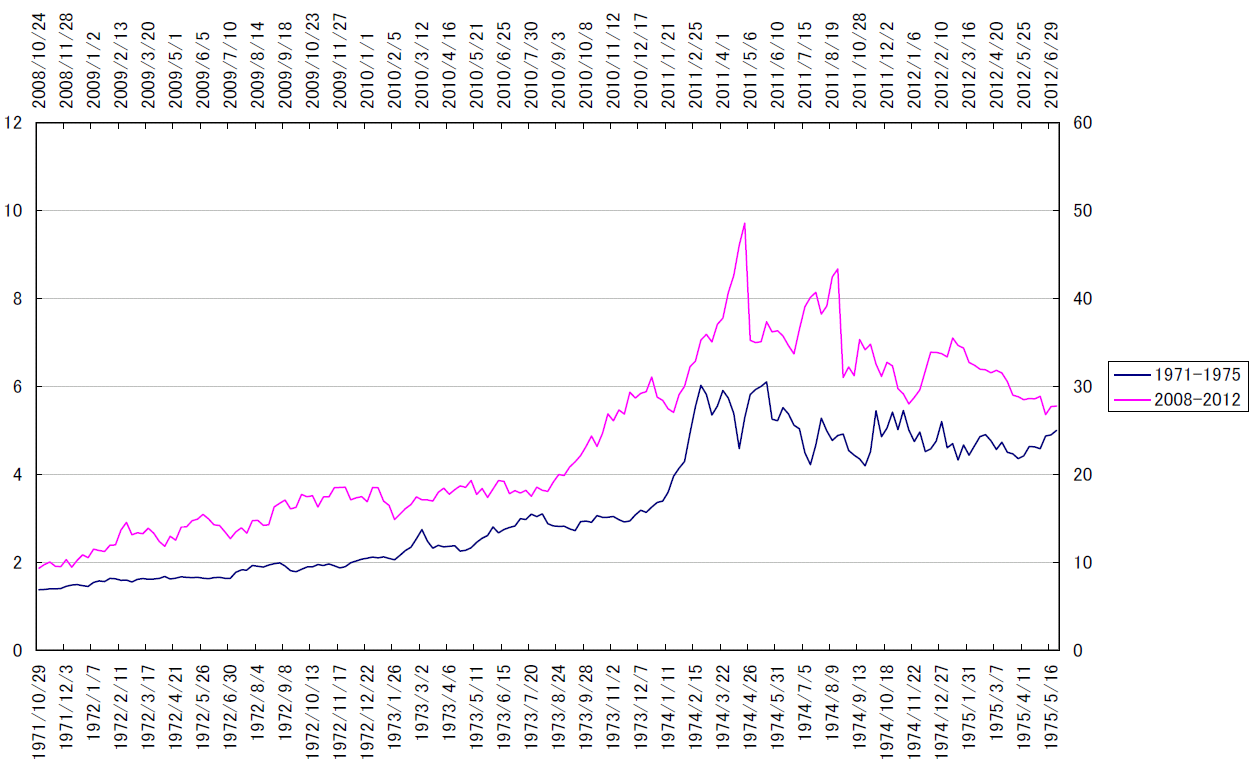
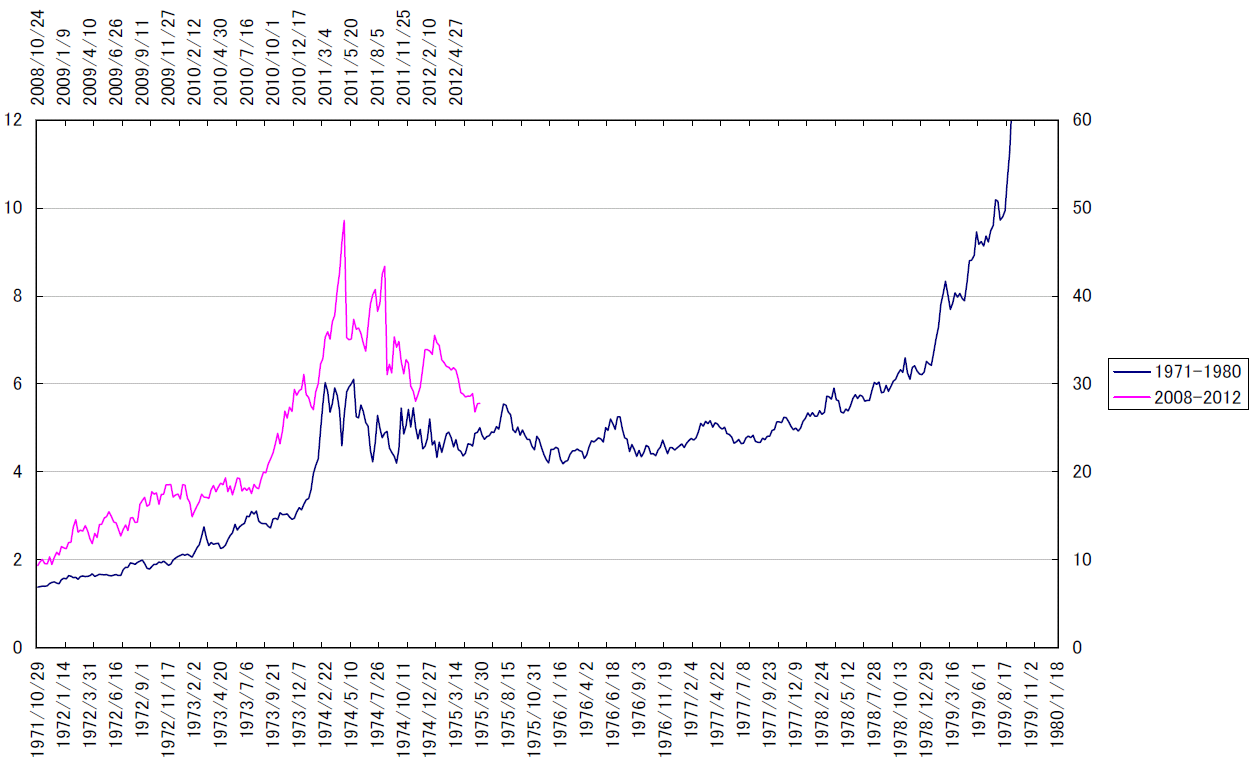
1971/10/29の週から1980/01/18の週までの銀の動きと2008/10/31の週から現在までの銀相場の動きを重ね合わせてみました。

日柄的にもほぼ同じ日数で上昇しています。

1971年のパターンでは、底値を切り上げたまま下落することなく1980年高値をとりました。

現在のパターンでも27ドル近辺では底堅く推移しておりよく似ています。

同じ日柄で天井を取るなら、2017/3/3の週に天井をとりにくることになります。

This is the chart of silver weekly data from 10/29/1971 to 01/18/1980 and from 10/31/2008 to last week.

We think “HIGARA” is very similar.

In 1971 pattern, the market price did not fall to the bottom around and took the highest in 1980.

In recent pattern, the market price did not cut 27point; this is very similar.

If the market price will take the highest as the same “HIGARA”, it will be 03/03/2017 week.

02

01


相場分析のリクエストがありましたら“Contact Us”からお知らせください。ご要望にお応えできるように努力いたします。

このブログはあくまでも個人的な見解であり、投資判断は各自でお願い致します。当ブログは一切の投資損益に対する責任を負いません。

ホームページに来て下さってありがとうございます。明日もよろしくお願いいたします。

If you have some request to analyze, please write to “Contact Us”.

We do best effort for your request.

These are only personal opinions on this blog, and you need the investment judgment in each one. This blog doesn’t assume the responsibility to all the investment profit and loss.

Thank for watching our contents. My best regards next day.
© 2026 Retar
