上海総合指数・下げトレンド入りか/ SSE Composite Index (Shanghai: 000001.SS). We think the market forms down side trend.

2012/03/28

本日は上海総合指数です。

昨日のデータで分析しています。

Today’s analyze is SSE Composite Index.

We use last day data.


昨日までの日足のチャートです。

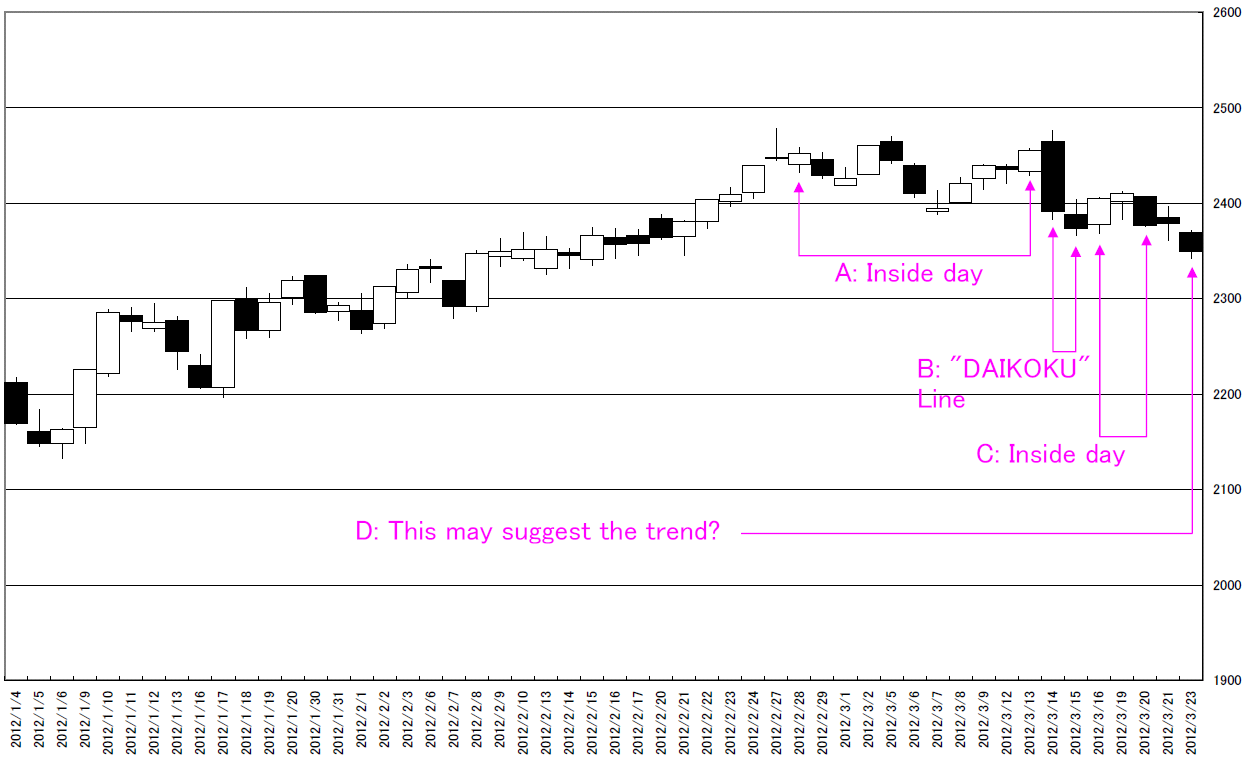
現在の相場は、酒田五法の「下げ足のカブセは売り決定線と知れ」に該当すると考えております。

注目はB地点です。2手を合わせると大きな大黒線となります。

前後の価格はツツミ線、ハラミ線となっています。(A点、C点)

This is the chart using last day data.

We think the recent market forms “SAGEASHI no KABUSE ha URI KETTEI sen to SHIRE” (Now is perfect selling point) by “SAKATA” way.

The most notable point is “B” point.

If two are united, it will become the big black candle stick.

And “A” and “C” points are inside “B” point.
01


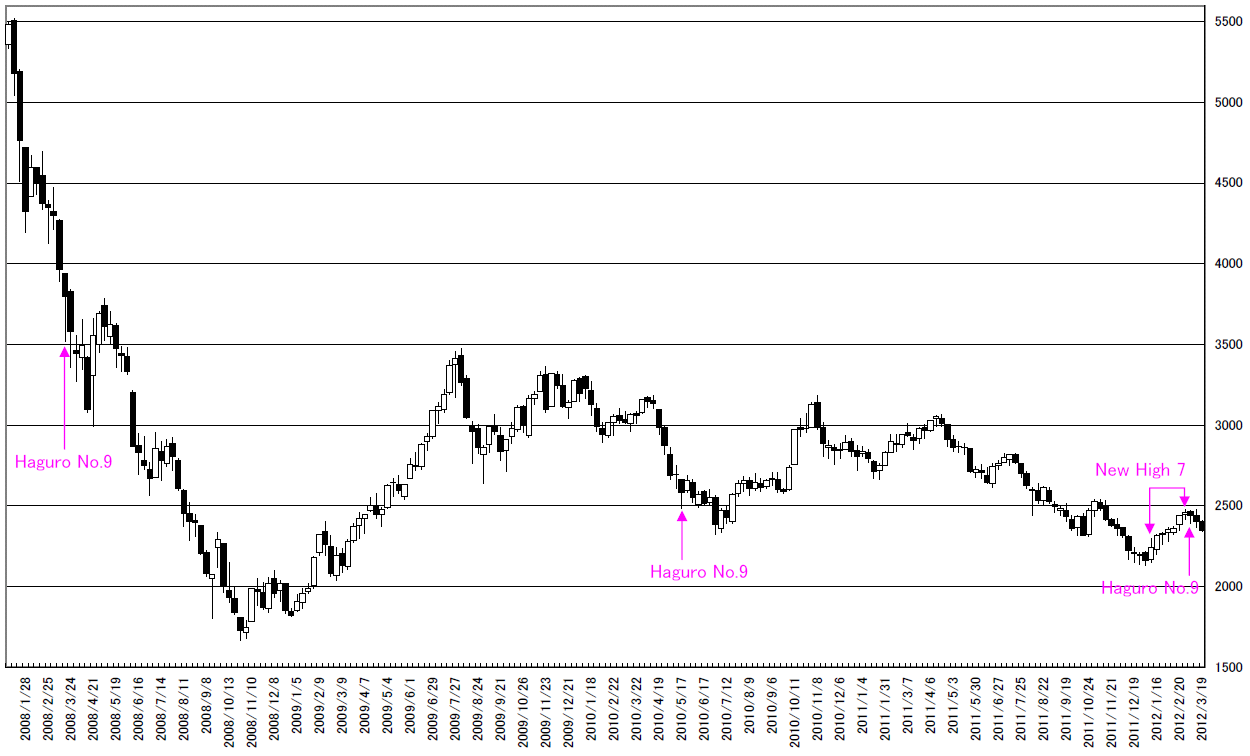
週足でみても、陽線新値7手です。

「新値八、十手は酒田の体の骨子なり」

そろそろ注意するべき段階です。

羽黒足の視点では頂点付近で9号線をだしています。

これもトレンド転換または押しを示唆するものだと考えております。

In weekly view, this is 7 new highs.

“New high 8-10 is the main point of ‘SAKATA’ way”.

We think now is careful point.

Other point of view, the market price formed “HAGURO” No. 9 at the peak around.

We think this may suggest the trend reverse or dip.
02


相場分析のリクエストがありましたら“Contact Us”からお知らせください。ご要望にお応えできるように努力いたします。

このブログはあくまでも個人的な見解であり、投資判断は各自でお願い致します。当ブログは一切の投資損益に対する責任を負いません。

ホームページに来て下さってありがとうございます。明日もよろしくお願いいたします。

If you have some request to analyze, please write to “Contact Us”.

We do best effort for your request.

These are only personal opinions on this blog, and you need the investment judgment in each one. This blog doesn’t assume the responsibility to all the investment profit and loss.

Thank for watching our contents. My best regards next day.
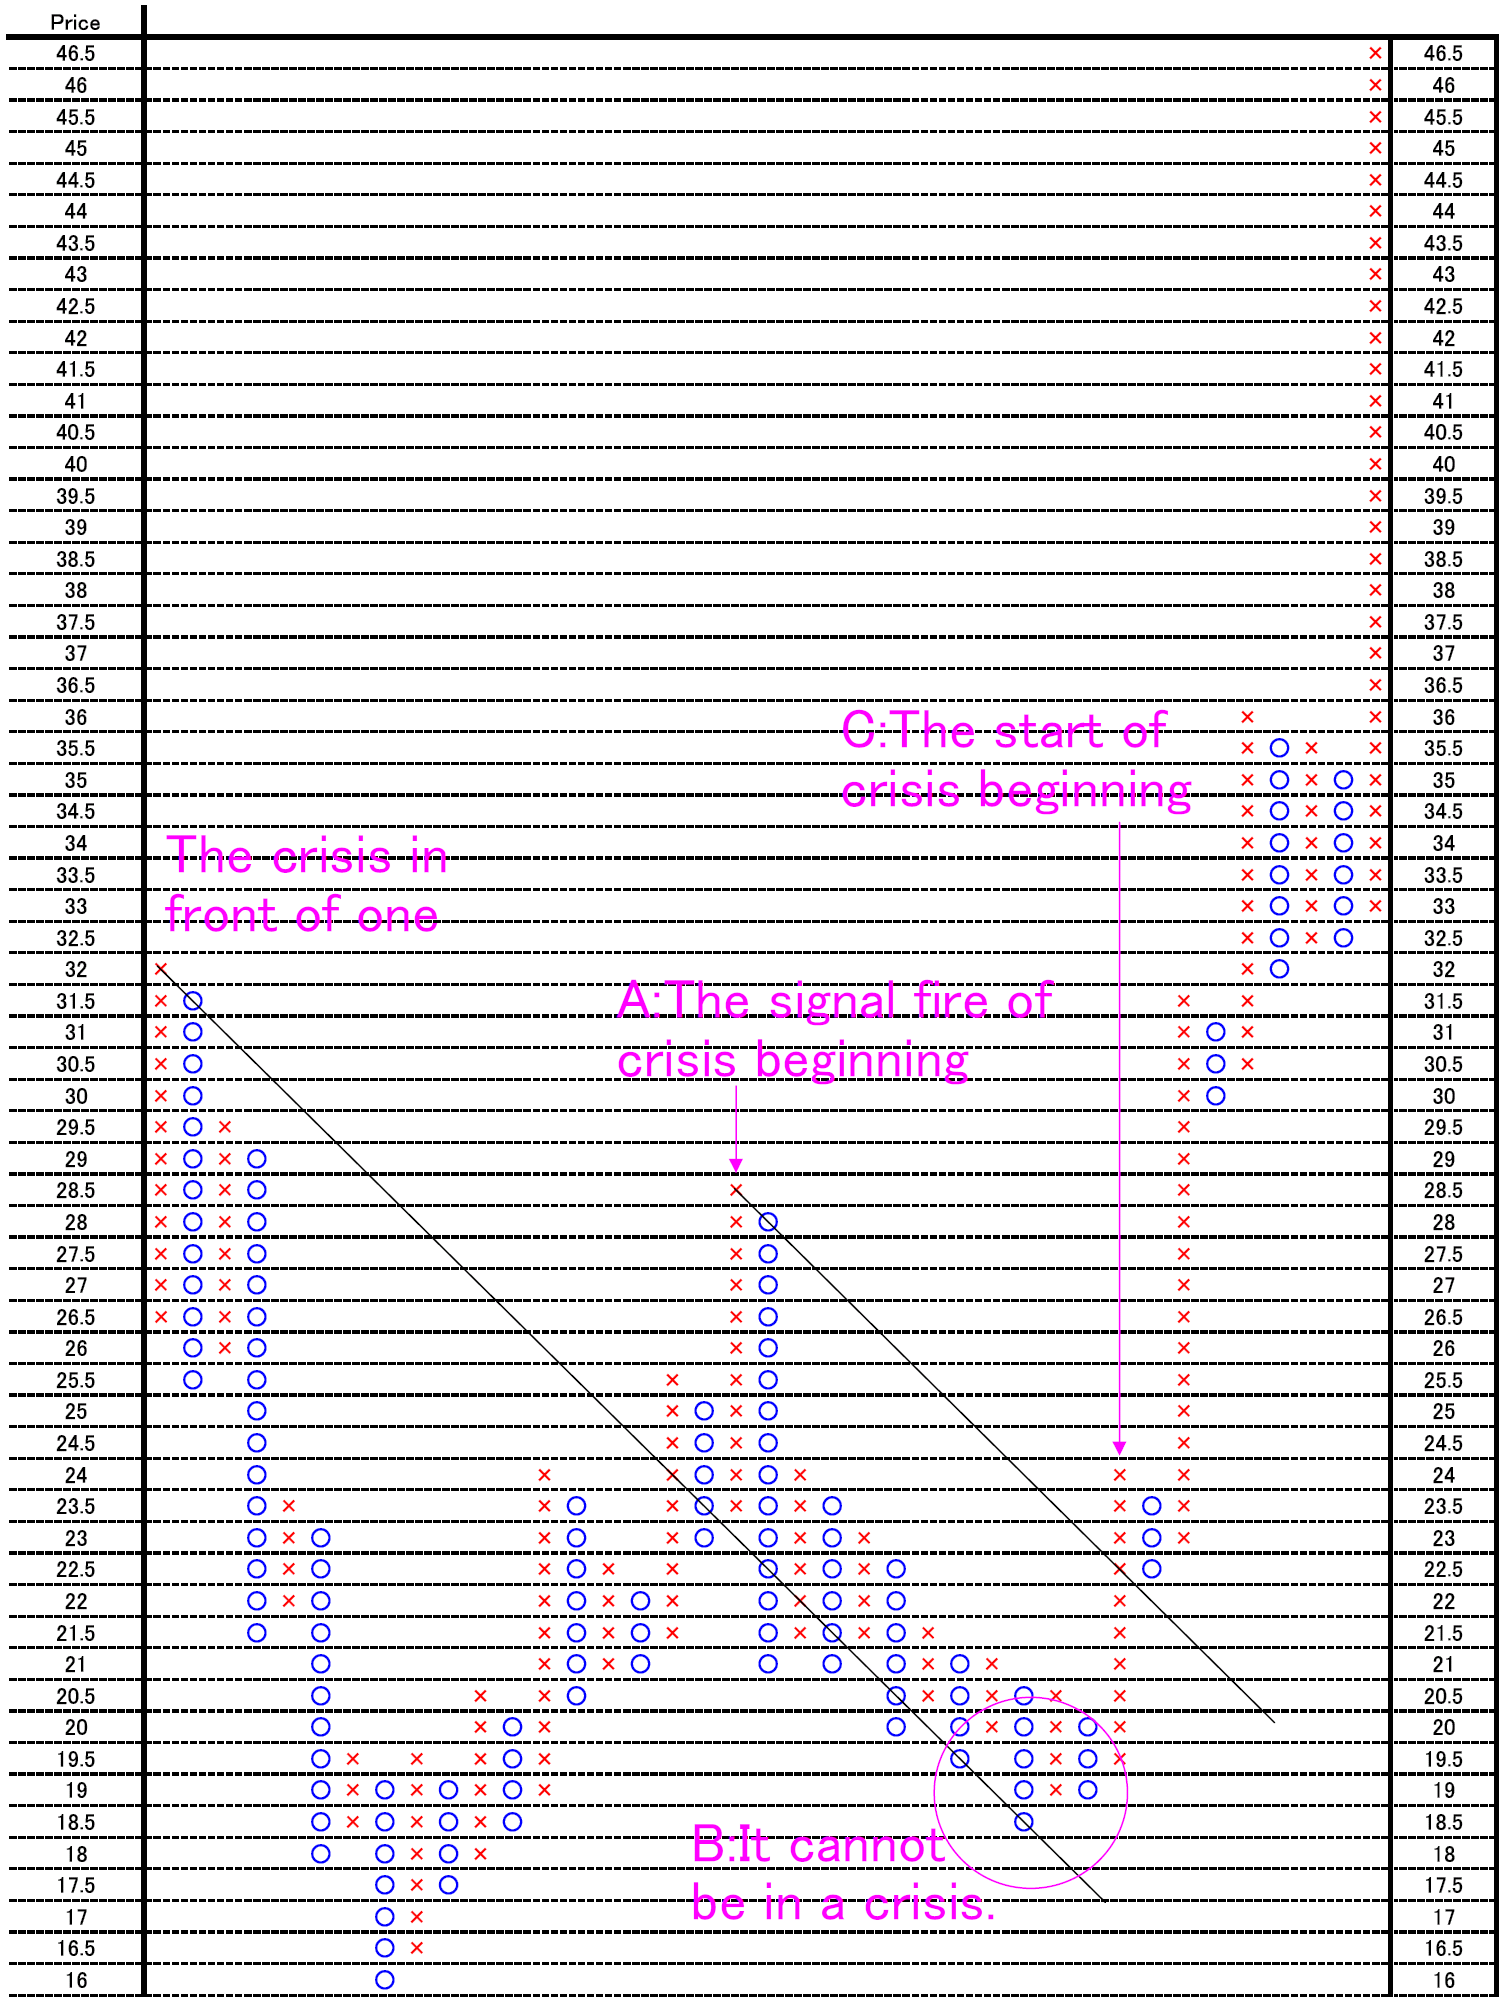
シカゴ・オプションVIX(恐怖心理指数)日足。上昇時は、いつも同じパターン/Chicago Options: ^VIX Daily. When the big rise occurs, the price move is the always same pattern.

2012/03/27

本日はシカゴ・オプションVIX(恐怖心理指数)日足についてです。

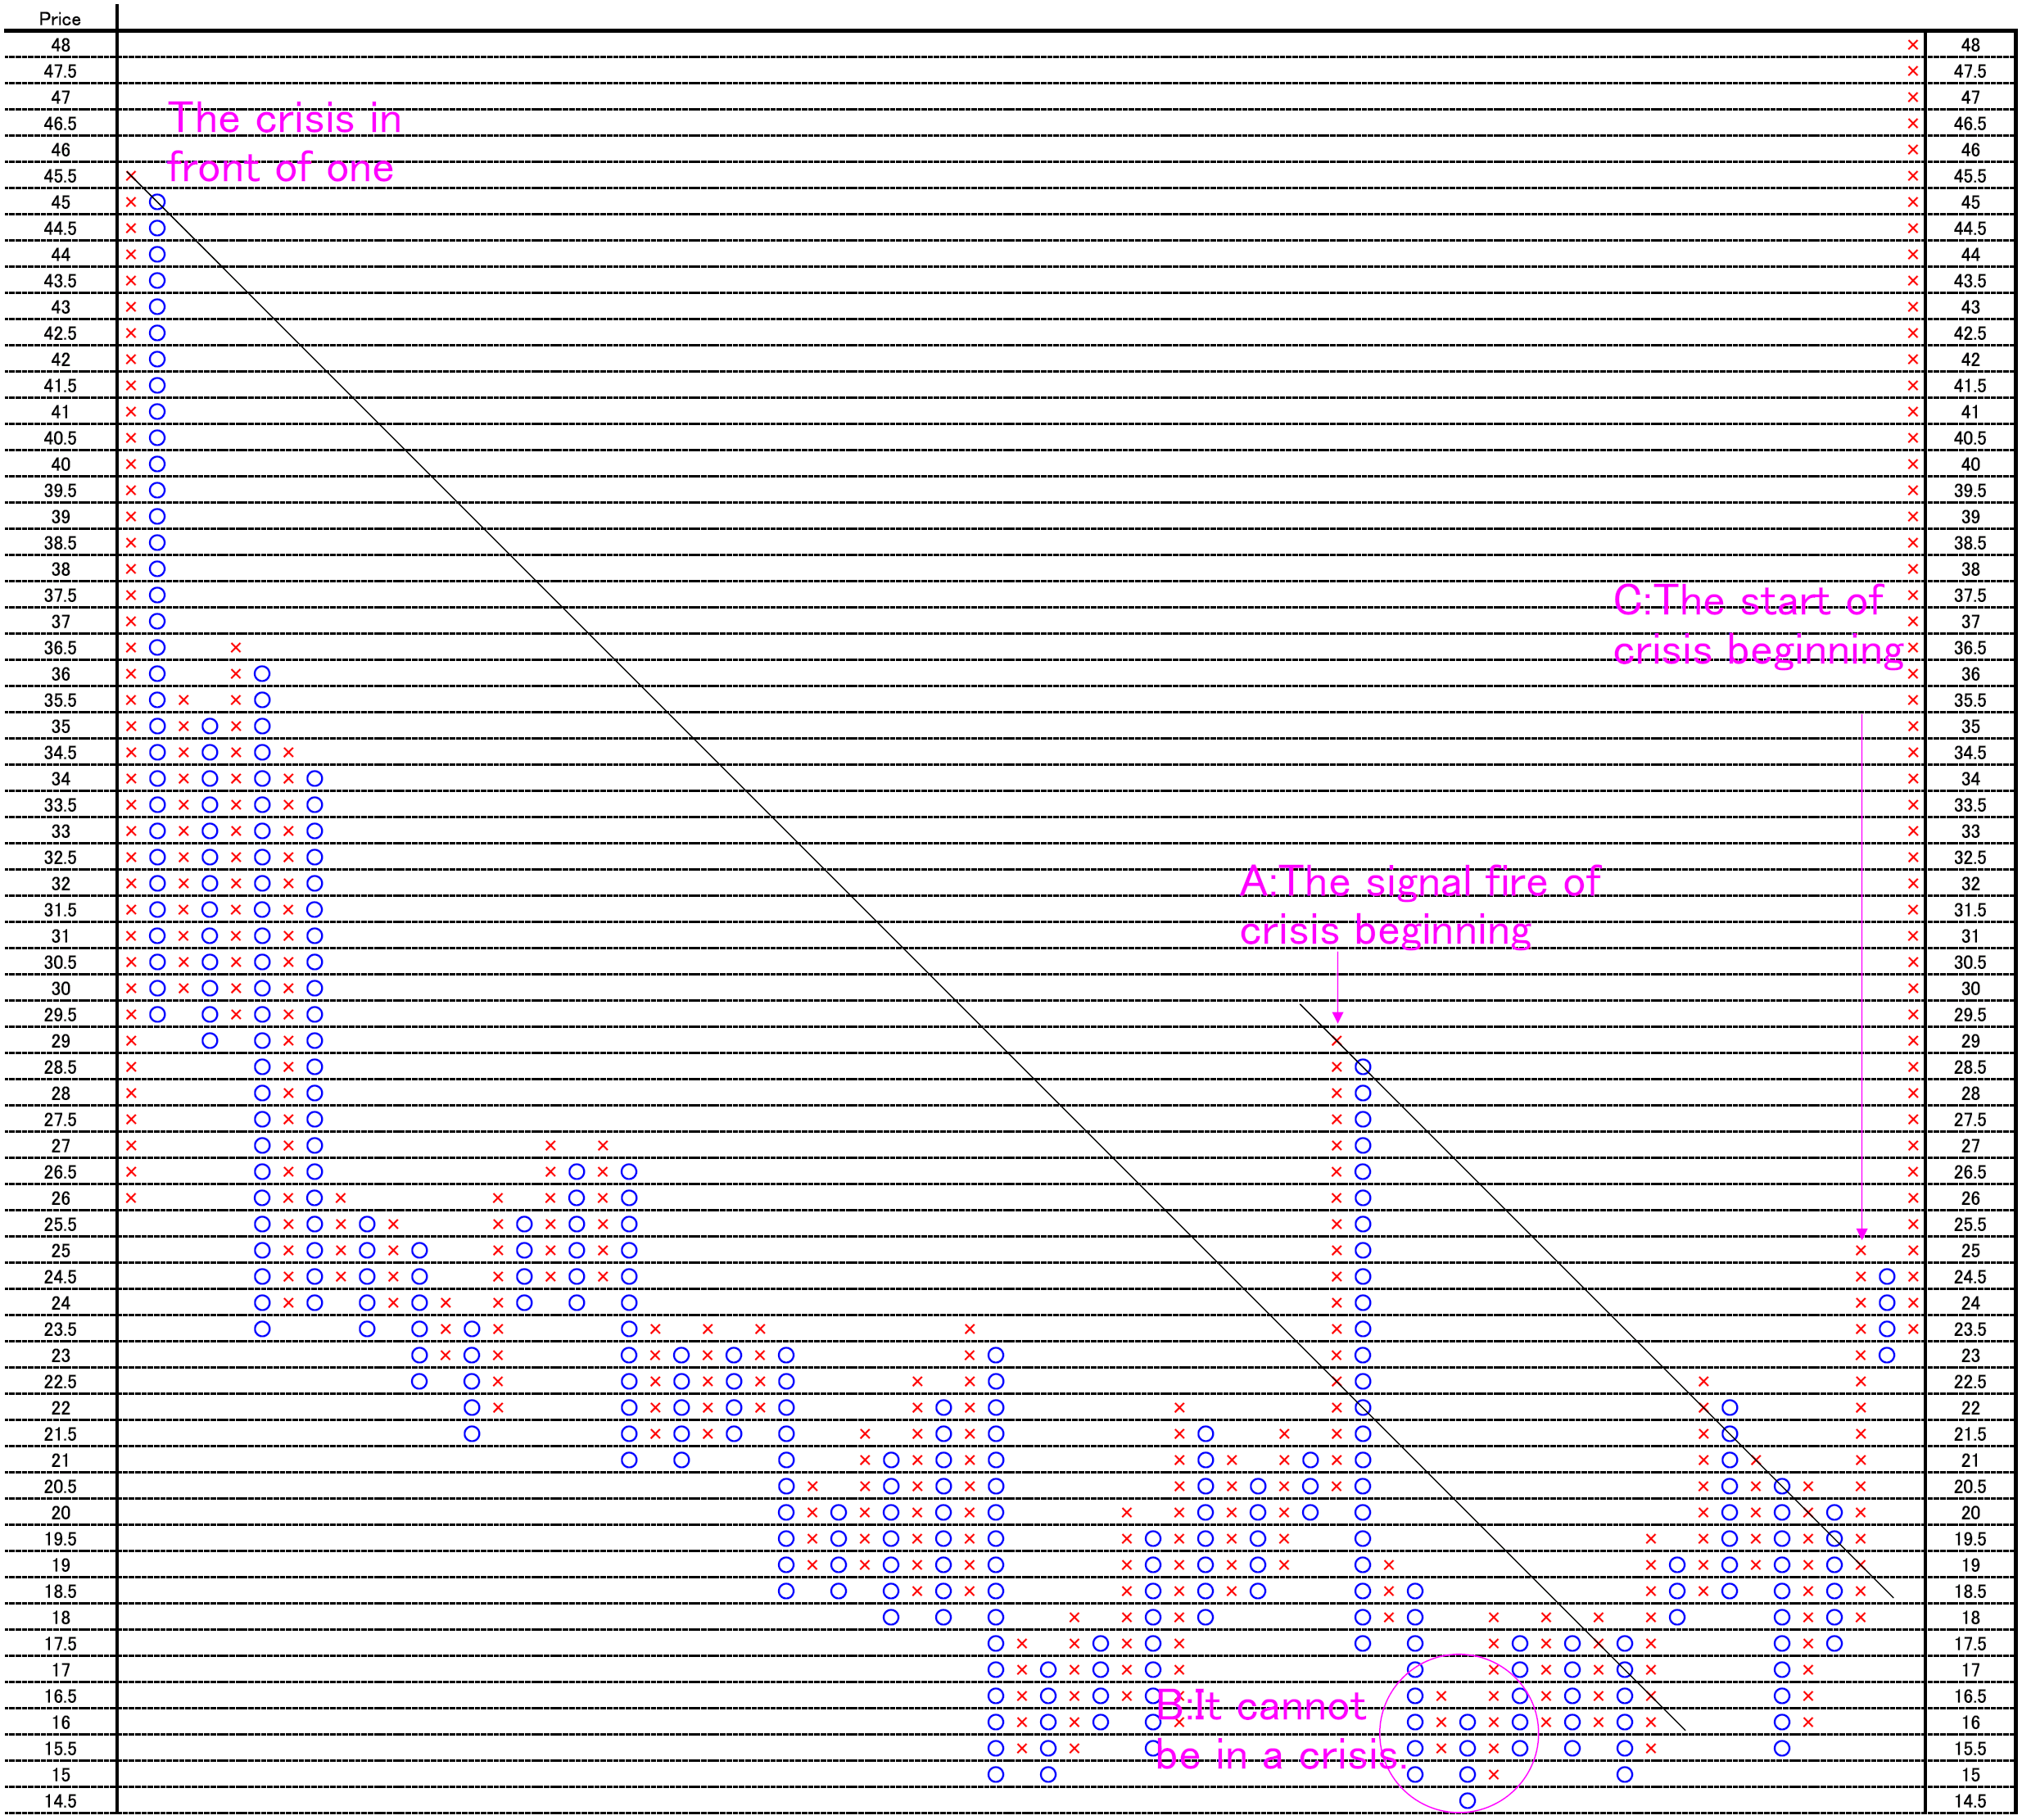
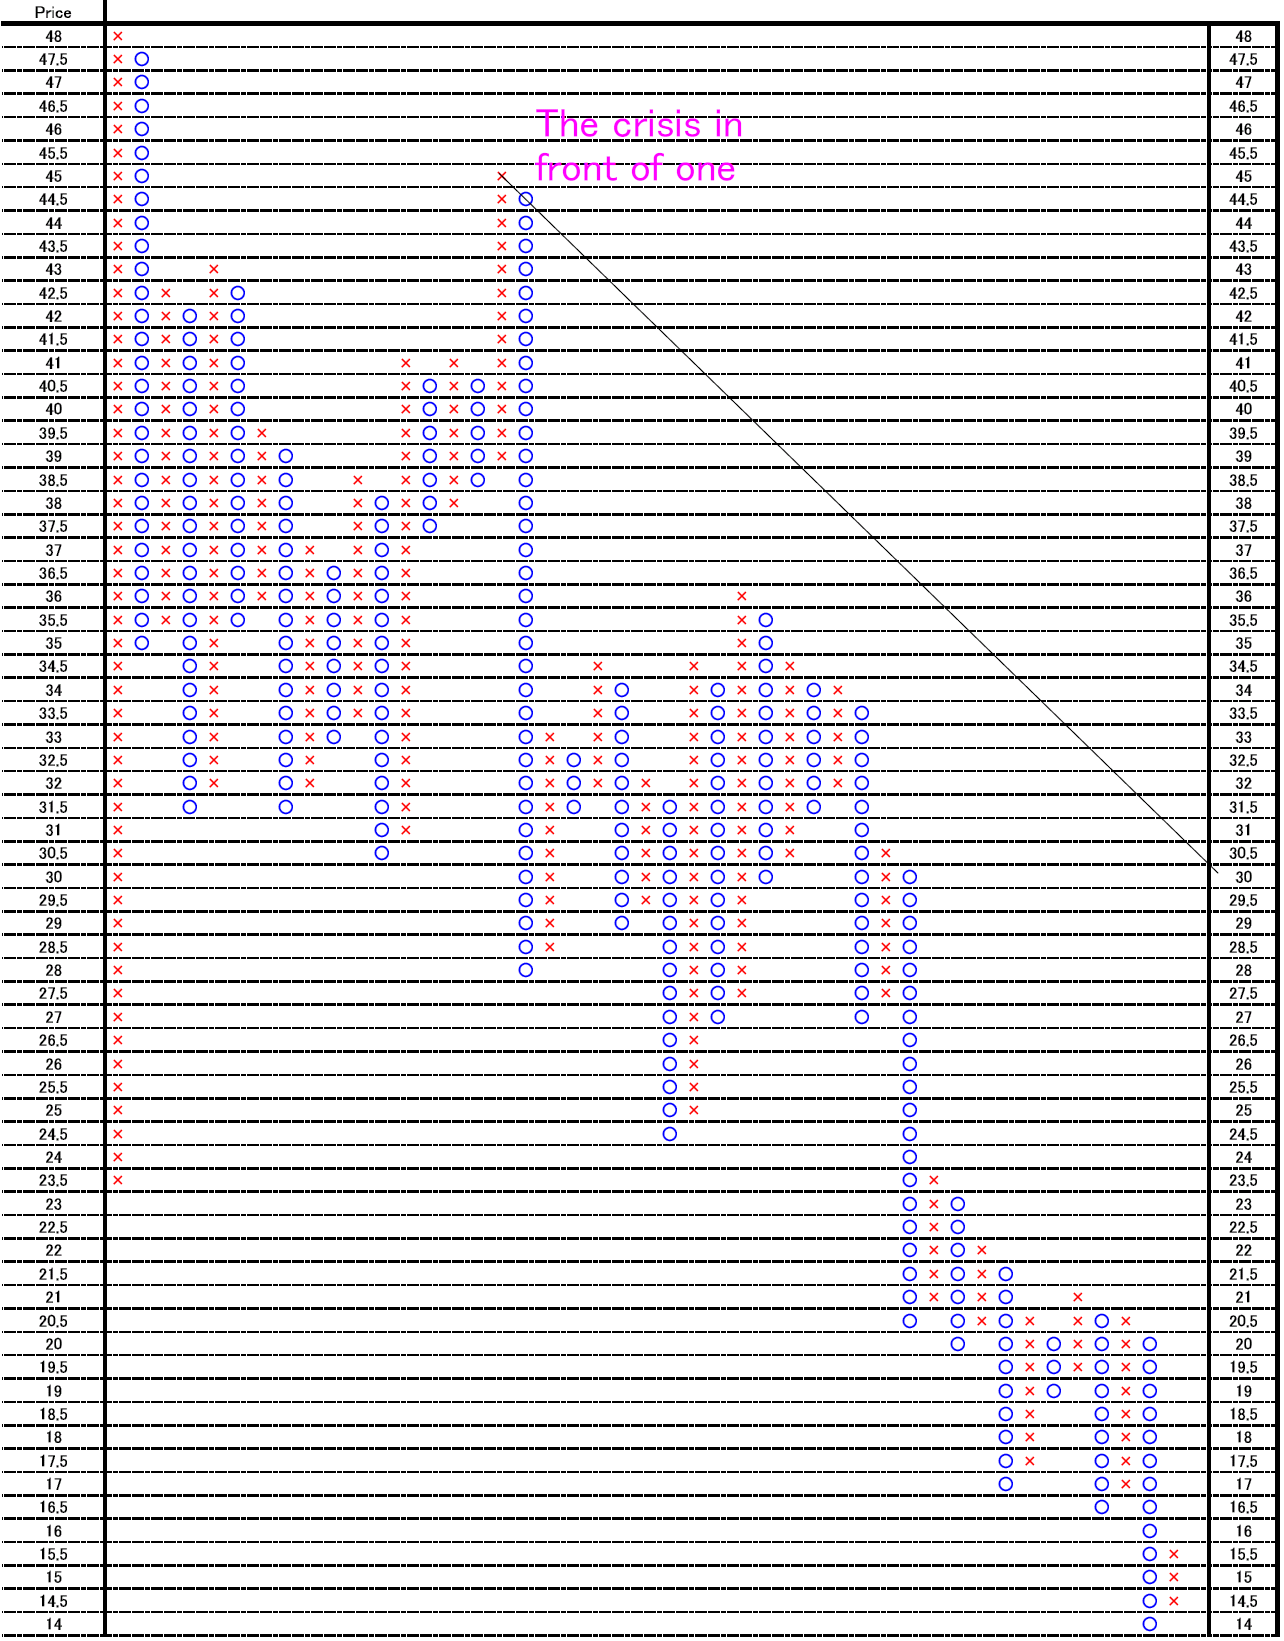
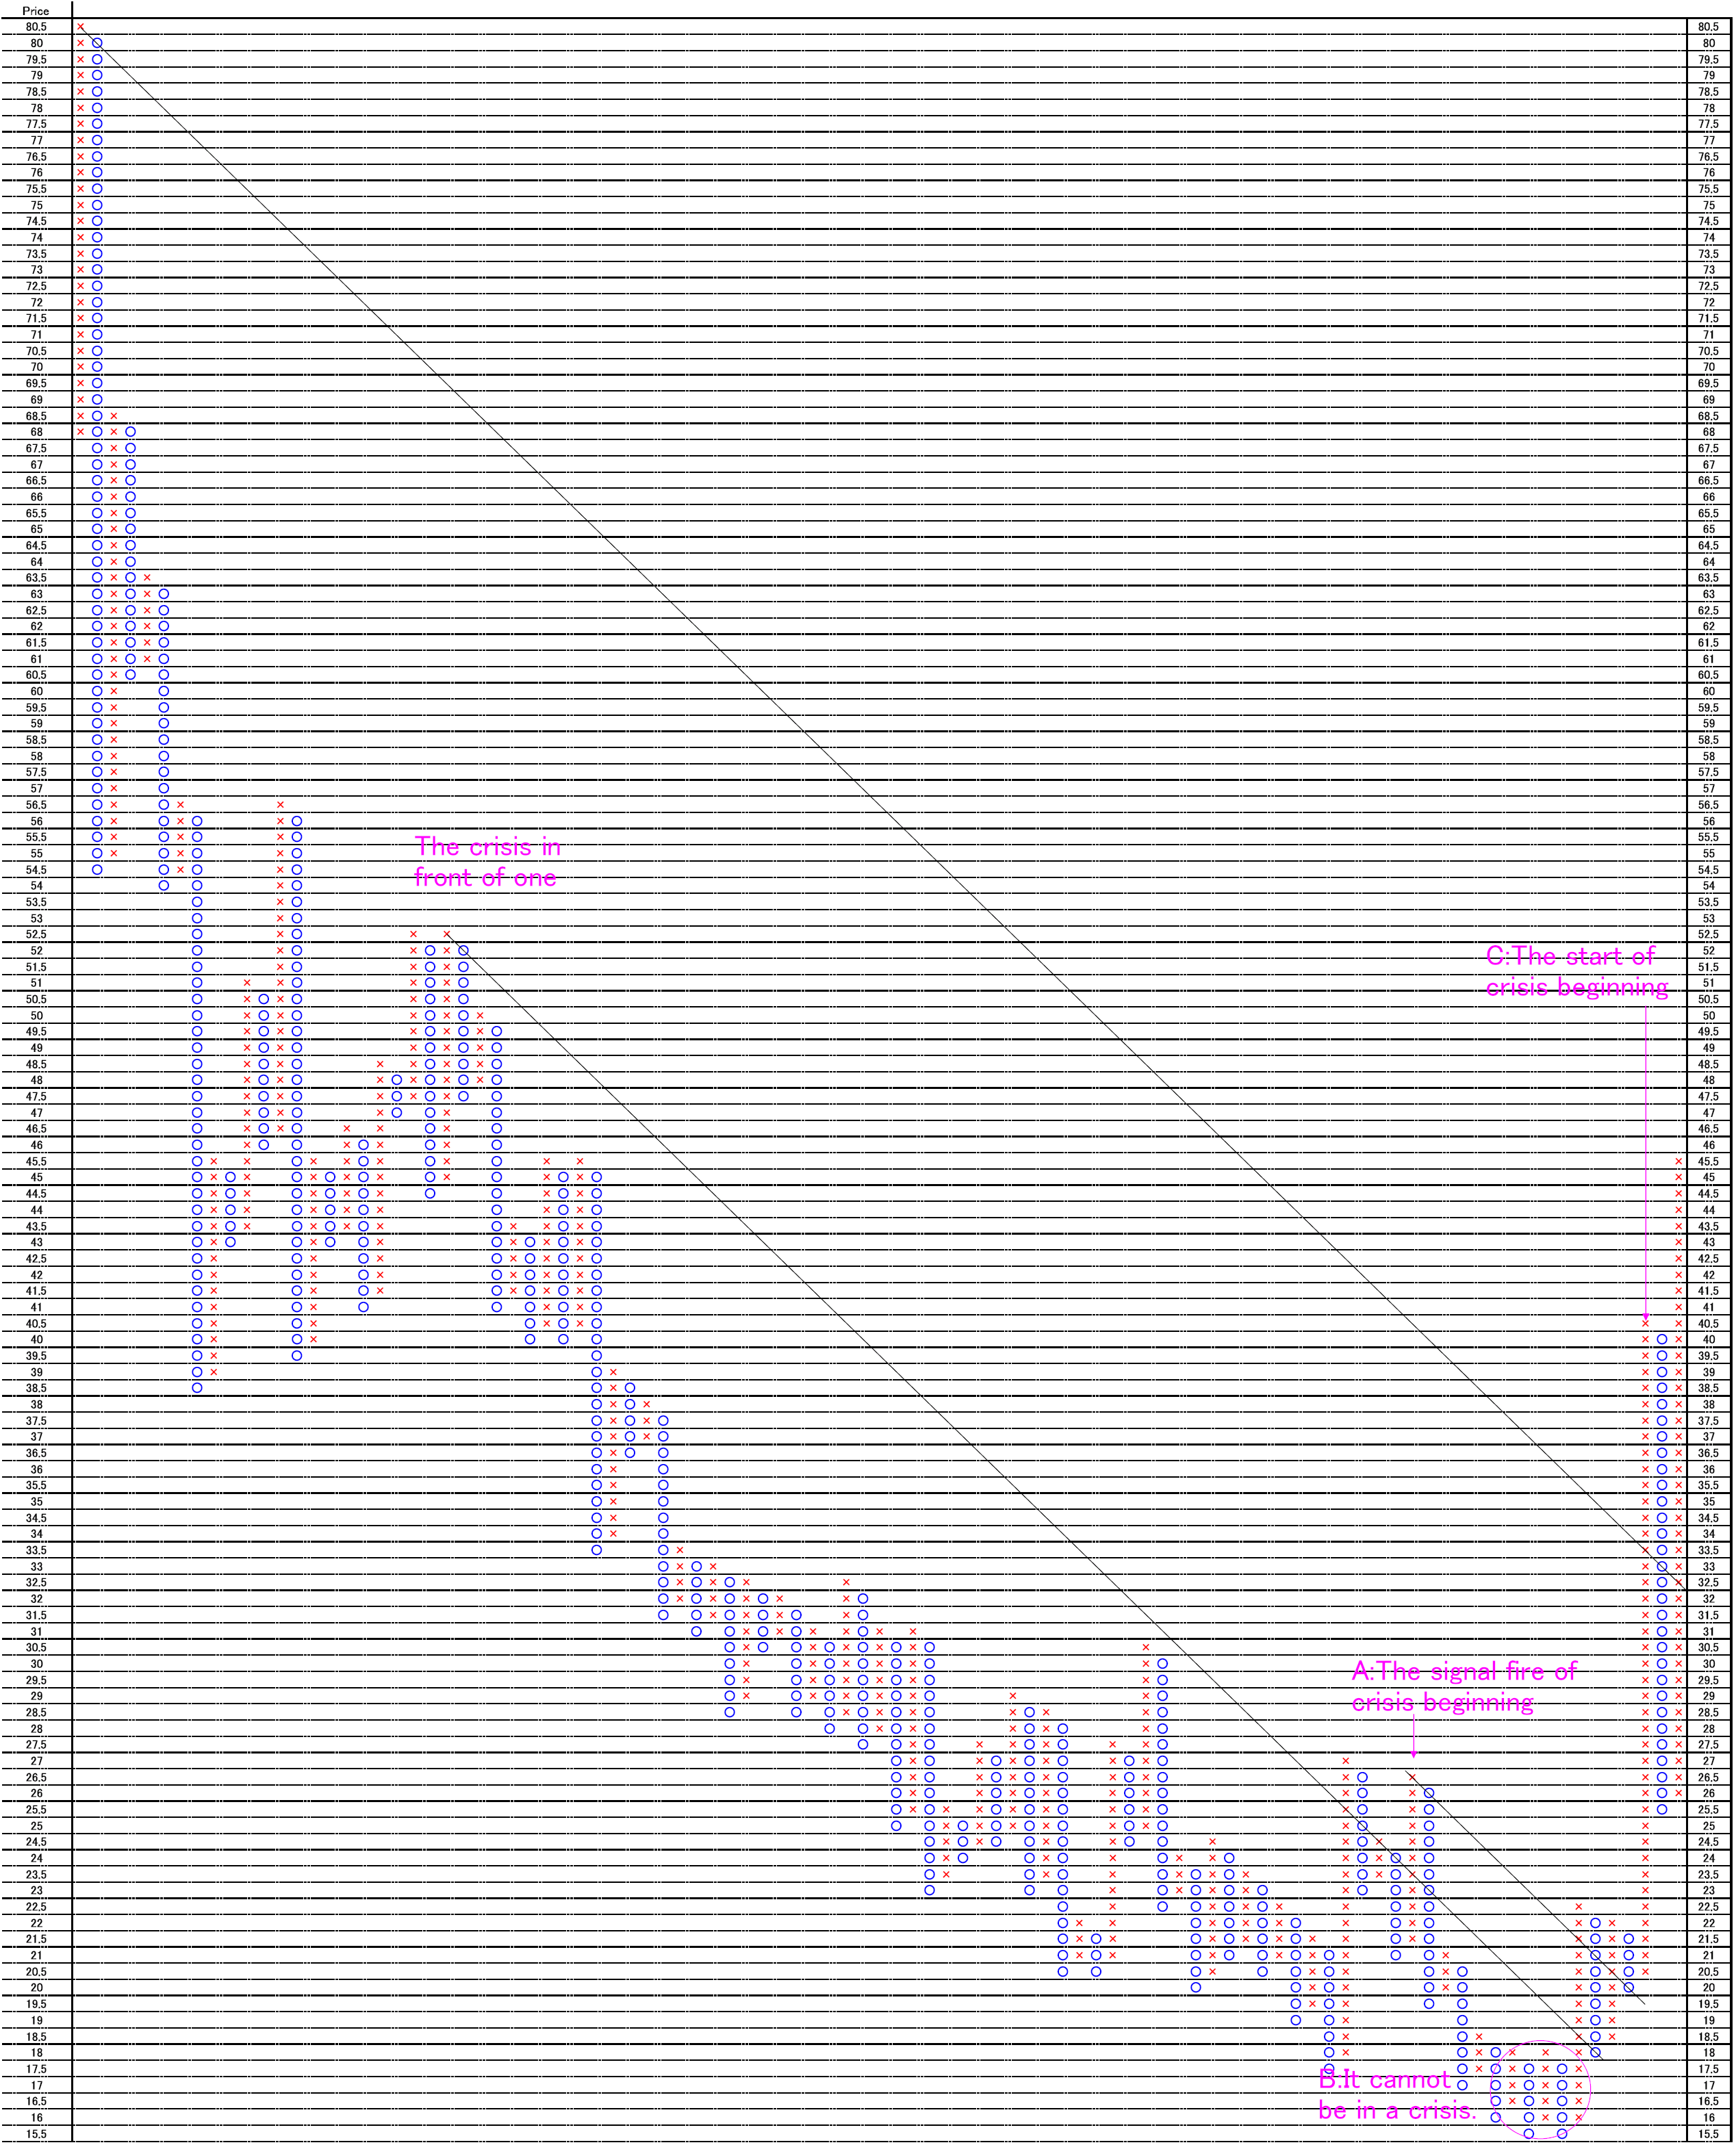
大きな上昇時の特徴をポイントアンドフィギュアで調査しました。

Today, we analyze Chicago Options: ^VIX Daily data.

We analyze unique character of big rise by Point and figure chart.

リーマンショック前(2008年)/Before Lehman Shock (2008)

01

ギリシャショック前(2010年)/Before Greek financial crisis(2010)

02


米国債格下げ前(2011年)/Before U.S. Treasury bond degradation (2011)

03


特徴をまとめると以下のようになります。

1. 前回高値からの45度線を超える。

2. A地点で高値を取って何事もなかったかのようにB地点まで下げる

3. A地点からの45度線を抜けて危機が始まる(C地点)

3回の危機は同じパターンでした。

The features are following.

1. The first, the market price cuts 45 degree resistance line from the last crisis.

2. The market price takes a peak “A”, and falls to “B” point as if there was nothing occasion.

3. The market price cuts 45 degree resistance line from “A” point, and the crisis is starting.

These 3 crises occur in same pattern.


最近の相場/The recent market

04


最近の相場では、米国債格下げ高値からの45度線を一度抜けておりません。

同じパターンで起こることを想定するなら、危機はA点を形成してから意識しても遅くはないと思います。

The recent market does not cut the 45 degree resistance from U.S. Treasury bond degradation.

If the market crisis may occurs as same pattern, it is not too late noticing until the market price forms “A” point.


相場分析のリクエストがありましたら“Contact Us”からお知らせください。ご要望にお応えできるように努力いたします。

このブログはあくまでも個人的な見解であり、投資判断は各自でお願い致します。当ブログは一切の投資損益に対する責任を負いません。

ホームページに来て下さってありがとうございます。明日もよろしくお願いいたします。

If you have some request to analyze, please write to “Contact Us”.

We do best effort for your request.

These are only personal opinions on this blog, and you need the investment judgment in each one. This blog doesn’t assume the responsibility to all the investment profit and loss.

Thank for watching our contents. My best regards next day.
© 2026 Retar